I did the math on the accounts I actively manage and the total return on all the money was +2.82%, net of fees. Normally I would say that that number stinks, but considering the following, I am okay with it –
The Fed did everything it could to trump Short Sellers, even making the practice illegal for several weeks
The 3-month US Treasury Yield spend most of 2008 below 2% and the last 4 months below 1%
Accounts were in 40% Short Term Treasuries almost all of the year
Accounts were at least 30% cash most of the year
I don’t remember a time where accounts were more than 40% invested
2008 was all about preservation of capital. The goal was to make sure that clients had the assets to allow them to continue to live their 2007 lifestyle in 2008. I lived through the Tech Wreck in 2000-2003 and promised to NEVER life through that again. I achieved my goal.
The S&P 500 was down -37.5% in 2008. That is its worst year since 1937, when it was down -37.6% (do you think it is a coincidence that the market rallied just enough in the last 2 days of trading to beat the returns of 1937? That would have been a marketing nightmare for the mutual fund industry).
So I beat the market by over 40% in 2008! I can stay in cash for years and the market will have to rally 80.6% to get back to even with me…
2009
I expect to have to take 2009 day-by-day. I expect it to be another grind. My most optimistic case for 2009 is a successful retest of the November 2008 lows. My most pessimistic case for 2009 is that the Treasury markets refuse to finance the $2 Trillion the US will need to borrow in the first half of 2009 and the markets have another large crash.
My crystal ball is cloudy and I have no clue how the year ends. I don’t even have a clue how next week ends. I will continue to study and try and be on the side of Big Money.
Right now, Big Money has been buying defensive shares – Healthcare/Biotech, Utilities and Consumer Staples
If and when Big Money starts to bet on an economic recovery, then they will start to buy the more cyclical shares, which they have been spurning – Financials, Technology, Industrials and Transports
Until Big Money starts to accumulate risky assets, with big flows of money, I will continue to take things one day at a time.
Friday, January 2, 2009


I Have Stop Orders in to Go Short
I figured that they could take the markets up to the top of the recent trading range. I actually figured that we would overshoot the tops of the range to suck in a bunch of Stop Buy Orders. That has occurred.
Most people are home on vacation, so the volume is light and the last few days of each month/first few days of each month have a positive bias, because retirement plans invest payroll deposits.
A recent phenomena is that Pension Funds do significant reallocation of assets in the last few days of each month. That has meant they have sold US Treasuries and bought Stocks and Commodities.
So I am taking this rally with a grain of salt and actually have but in Stop Buy Orders to buy the Inverse (Short) ETFs above current prices. I like DUG (-2x Energy Stocks) and SKF (-2x Financials). I sold SKF in the mid $120’s last week and now have orders in at $106.
Most people are home on vacation, so the volume is light and the last few days of each month/first few days of each month have a positive bias, because retirement plans invest payroll deposits.
A recent phenomena is that Pension Funds do significant reallocation of assets in the last few days of each month. That has meant they have sold US Treasuries and bought Stocks and Commodities.
So I am taking this rally with a grain of salt and actually have but in Stop Buy Orders to buy the Inverse (Short) ETFs above current prices. I like DUG (-2x Energy Stocks) and SKF (-2x Financials). I sold SKF in the mid $120’s last week and now have orders in at $106.
Monday, December 29, 2008
Sold
This morning, the markets got down to the hourly support levels for the recent trading ranges, so I sold the remainder of my SKF (-2x Short Financials) and all of my PSQ (Short NASDAQ).
I figure that they won't let things crack this week.
NASDAQ
The NASDAQ (QQQQ) has been stuck in a trading range since early December. Here is the hourly chart of the QQQQ with volatility bands. The +/- 0.5 band (Black Lines) has defined this trading range.
I covered my shorts on the NASDAQ this morning, by selling my PSQ (Short NASDAQ).
The NASDAQ will break out of this trading range soon. I’m just don’t think it will occur this week.
I figure that they won't let things crack this week.
NASDAQ
The NASDAQ (QQQQ) has been stuck in a trading range since early December. Here is the hourly chart of the QQQQ with volatility bands. The +/- 0.5 band (Black Lines) has defined this trading range.
I covered my shorts on the NASDAQ this morning, by selling my PSQ (Short NASDAQ).
The NASDAQ will break out of this trading range soon. I’m just don’t think it will occur this week.

Financials (XLF)
The Financial Index is now testing the low of its recent trading range at $11.50 (Orange Line). $11.50 is support, until proven otherwise. So I sold my SKF (2x Short Financials).
The Financial Index is now testing the low of its recent trading range at $11.50 (Orange Line). $11.50 is support, until proven otherwise. So I sold my SKF (2x Short Financials).

These trading ranges may break down tonight, or support may hold. I have no clue.
But I know that if support holds, yet again, then I would be really ticked at myself for not booking small profits.
I am now operating under the assumption that they do not want prices to fall hard in the last week of the year.
I will scan charts tonight to see if anything is setting up. From what I have seen so far, there may be a short set up in Gold and US Treasuries. We’ll see if big money shows up and the trades trigger.
But I know that if support holds, yet again, then I would be really ticked at myself for not booking small profits.
I am now operating under the assumption that they do not want prices to fall hard in the last week of the year.
I will scan charts tonight to see if anything is setting up. From what I have seen so far, there may be a short set up in Gold and US Treasuries. We’ll see if big money shows up and the trades trigger.
Wednesday, December 24, 2008
2009 The Year of the Pork Barrel
I want to start off with my 2009 prediction...
My best guess is that 2009 is the Year of the Hog on the Chinese calendar, because that $1 trillion “Stimulus Package” will be the biggest pork barrel transfer of wealth from taxpayer to political cronies in the history of mankind.
Madoff
I have been telling clients all year that Hedge Funds have a history of inflating their performance numbers and then fessing up by taking an artificially large loss early in the following year. The fact that any entity in the investment community has the capability to fudge performance numbers is a really by indication of how lax regulations are and how bad oversight is.
The implosion of the Madoff Hedge Fund is the canary in the coal mine for the Hedge Fund/Fund of Funds/Alternate Investment/Managed Futures industry. Either regulators will have to start taking the auditing of Hedge Fund performance numbers seriously, or investors will pull their money from that investment product.
The big question for me right now is – how much of the performance numbers for Hedge Fund and Managed Futures Indexes were the result of Madoff’s bogus numbers? The big argument for owning this asset class is that it performs well during times where stocks are down. This improves the overall performance of the portfolio during bad years.
But what if a significant amount of the outperformance for Hedge Funds during down years was actually generated by the bogus numbers of Madoff’s Fund? I am going to email some people about this topic and will relay their thoughts to you.
On to the Markets
I hear a lot of people on TV telling me that the markets have found their “bottom”, that stocks are “cheap” values” “bargains” and that their targets for 2009 are someplace well above where we are now. My crystal ball is cloudy… I have no clue where we end 2009, and neither do the guys on TV.
I just want to look at the charts of the sectors to gauge the health of the markets, as we enter 2009. I see two patterns right now. Indexes have either made narrow rallies into declining moving averages (wedges) or they are stuck in narrow trading ranges. Now, things can change very quickly, but neither pattern is very promising.
Wedges
Here is the chart of the S&P 500 Index (SPY). I see a bounce up into the declining 50-day moving average (Black Line) after a crash, on declining volume (Red Line and Arrow). That is very bearish.

Basic Materials (XLB), Financials (XLF), Industrials (XLI), Technology (XLK), Retail (XRT), Housing (XHB) and Semiconductors (SMH) each have patterns similar to the S&P 500.


Healthcare (XLV) and Consumer Discretionary (XLY), have similar patterns, but have held up better, in relation to the October lows.


Couldn’t Even Bounce
These sectors could not bounce, while the markets were able to make sharp bounces from recent lows. That is not a good sign for these sectors – Energy (XLE), Consumer Products (XLP) and Utilities (XLU).


Individual Stocks
Here are some stocks that scare me as we enter into the new year.
Microsoft (MSFT) is still well below key resistance ($20.68). It can’t get even get to the 50-day and has appeared to have broken its recent uptrend. I just saw some guy on CNBC tell viewers that Microsoft is now a “utility” and is his low risk pick for 2009. Who are these clowns who run these TV shows…

American Express (AXP)
Here is another stock that can’t get anywhere near its 50-day. I consider AmEx to be an important company. I don’t think its performance is a good thing for the markets.

Apple (AAPL)
This former darling looks like it is setting up for another leg down.

Leaders
Now, onto the leading names, with strong growth, breaking out of trading ranges on heavy volume.
There aren’t any…
My best guess is that 2009 is the Year of the Hog on the Chinese calendar, because that $1 trillion “Stimulus Package” will be the biggest pork barrel transfer of wealth from taxpayer to political cronies in the history of mankind.
Madoff
I have been telling clients all year that Hedge Funds have a history of inflating their performance numbers and then fessing up by taking an artificially large loss early in the following year. The fact that any entity in the investment community has the capability to fudge performance numbers is a really by indication of how lax regulations are and how bad oversight is.
The implosion of the Madoff Hedge Fund is the canary in the coal mine for the Hedge Fund/Fund of Funds/Alternate Investment/Managed Futures industry. Either regulators will have to start taking the auditing of Hedge Fund performance numbers seriously, or investors will pull their money from that investment product.
The big question for me right now is – how much of the performance numbers for Hedge Fund and Managed Futures Indexes were the result of Madoff’s bogus numbers? The big argument for owning this asset class is that it performs well during times where stocks are down. This improves the overall performance of the portfolio during bad years.
But what if a significant amount of the outperformance for Hedge Funds during down years was actually generated by the bogus numbers of Madoff’s Fund? I am going to email some people about this topic and will relay their thoughts to you.
On to the Markets
I hear a lot of people on TV telling me that the markets have found their “bottom”, that stocks are “cheap” values” “bargains” and that their targets for 2009 are someplace well above where we are now. My crystal ball is cloudy… I have no clue where we end 2009, and neither do the guys on TV.
I just want to look at the charts of the sectors to gauge the health of the markets, as we enter 2009. I see two patterns right now. Indexes have either made narrow rallies into declining moving averages (wedges) or they are stuck in narrow trading ranges. Now, things can change very quickly, but neither pattern is very promising.
Wedges
Here is the chart of the S&P 500 Index (SPY). I see a bounce up into the declining 50-day moving average (Black Line) after a crash, on declining volume (Red Line and Arrow). That is very bearish.

Basic Materials (XLB), Financials (XLF), Industrials (XLI), Technology (XLK), Retail (XRT), Housing (XHB) and Semiconductors (SMH) each have patterns similar to the S&P 500.


Healthcare (XLV) and Consumer Discretionary (XLY), have similar patterns, but have held up better, in relation to the October lows.


Couldn’t Even Bounce
These sectors could not bounce, while the markets were able to make sharp bounces from recent lows. That is not a good sign for these sectors – Energy (XLE), Consumer Products (XLP) and Utilities (XLU).


Individual Stocks
Here are some stocks that scare me as we enter into the new year.
Microsoft (MSFT) is still well below key resistance ($20.68). It can’t get even get to the 50-day and has appeared to have broken its recent uptrend. I just saw some guy on CNBC tell viewers that Microsoft is now a “utility” and is his low risk pick for 2009. Who are these clowns who run these TV shows…

American Express (AXP)
Here is another stock that can’t get anywhere near its 50-day. I consider AmEx to be an important company. I don’t think its performance is a good thing for the markets.

Apple (AAPL)
This former darling looks like it is setting up for another leg down.

Leaders
Now, onto the leading names, with strong growth, breaking out of trading ranges on heavy volume.
There aren’t any…
Tuesday, December 23, 2008
Keep Your Losses Small
I wanted to follow up on my last post.
Small losses are a part of the business. Not all setup that trigger become profitable. I always assume that I will have more losing trades than winners (I am not sure if that is the case), so my losses per trade have to be smaller than my gains per trade.
Crude Oil
I got stopped into Oil (USO) and then got stopped out at $31.80 yesterday. USO has been as low at 29.13 this morning. I still expect a real strong bounce on Oil at some point. To give you example of the power of the potential bounce, Natural Gas (UNG) has rallied 9.5% intraday. So I will be looking for other setups in the future.
Financials
A few days ago, I added to my short positions on Financials via SKF at $109 or so. I took half of my SKF out this morning. That gives me about a 3% exposure to SKF.
NASDAQ
I had stops in to buy QQQQ (Bullish NASDAQ) and PSQ (Bearish NASDAQ). PSQ triggered and I now hold it. PSQ did its annual distribution of dividends and capital gains today. The distributions were a total of $4.2547 per share. So I am up a few percent on PSQ. The distribution will hit my account on 12/30.
Small losses are a part of the business. Not all setup that trigger become profitable. I always assume that I will have more losing trades than winners (I am not sure if that is the case), so my losses per trade have to be smaller than my gains per trade.
Crude Oil
I got stopped into Oil (USO) and then got stopped out at $31.80 yesterday. USO has been as low at 29.13 this morning. I still expect a real strong bounce on Oil at some point. To give you example of the power of the potential bounce, Natural Gas (UNG) has rallied 9.5% intraday. So I will be looking for other setups in the future.
Financials
A few days ago, I added to my short positions on Financials via SKF at $109 or so. I took half of my SKF out this morning. That gives me about a 3% exposure to SKF.
NASDAQ
I had stops in to buy QQQQ (Bullish NASDAQ) and PSQ (Bearish NASDAQ). PSQ triggered and I now hold it. PSQ did its annual distribution of dividends and capital gains today. The distributions were a total of $4.2547 per share. So I am up a few percent on PSQ. The distribution will hit my account on 12/30.
Thursday, December 18, 2008
Something's Got to Give
I think the markets are at a crossroads and need to make a decision very soon. That would mean volatility and the opportunity to make some money. I think it is a trading opportunity. If it is a rally, then I expect a really good shorting opportunity in the next few weeks. If it is a breakdown, then I expect the opportunity to buy a retest of the 11/21 lows.
I don’t even know what I am having for dinner tonight. That is how short term my expectations are on this set up. I have already closed out purchases of the last 2 days – XHB, XLK, JNK and MYC. My trading positions have been small and I have been quick to take profits.
I Like Exchange Traded Funds
This removes company-specific events which may compromise an individual stock, even though the group may work. When really leaders with high growth show up again, then I will look at stocks again.
I see two very good potential trades. These aren’t recommendations! I’m just showing you what I am seeing. Most of you will look at all the lines, roll your eyes and go back to ESPN or CNN… I want my thoughts archived for future analysis of what worked and what didn't.
The NASDAQ 100 Index (QQQQ)
QQQQ has been trading in a narrow range between $28.5 and $30.5 for the last 9 trading days. Hourly volatility is now at extremely low readings, so a new trend may not be far away.
The trading range is capped by the Blue Line. See how this line has proven to be support (Blue Arrows) and resistance (Red Arrows) since the 10/10 low? It is a critical price level and traders have been keying off of it. Since mid-November, all rallies into it have been sold.
The trendline off the 11/21 low (Citibank bailout) has proven to be substantial support (Green Line and Arrows). It has held on all attempted selloffs.
Something has to give. Either resistance is taken out and the markets rally sharply, or support is taken out and we fall sharply. I think we are still in a Bear Market, so I am not invested in stocks and don’t care which way we go. I can make money in either direction. I just want a strong trend!
If resistance is taken out, then I want to own QQQQ. I will put in Stop Orders to Buy above $30.50.
I don’t even know what I am having for dinner tonight. That is how short term my expectations are on this set up. I have already closed out purchases of the last 2 days – XHB, XLK, JNK and MYC. My trading positions have been small and I have been quick to take profits.
I Like Exchange Traded Funds
This removes company-specific events which may compromise an individual stock, even though the group may work. When really leaders with high growth show up again, then I will look at stocks again.
I see two very good potential trades. These aren’t recommendations! I’m just showing you what I am seeing. Most of you will look at all the lines, roll your eyes and go back to ESPN or CNN… I want my thoughts archived for future analysis of what worked and what didn't.
The NASDAQ 100 Index (QQQQ)
QQQQ has been trading in a narrow range between $28.5 and $30.5 for the last 9 trading days. Hourly volatility is now at extremely low readings, so a new trend may not be far away.
The trading range is capped by the Blue Line. See how this line has proven to be support (Blue Arrows) and resistance (Red Arrows) since the 10/10 low? It is a critical price level and traders have been keying off of it. Since mid-November, all rallies into it have been sold.
The trendline off the 11/21 low (Citibank bailout) has proven to be substantial support (Green Line and Arrows). It has held on all attempted selloffs.
Something has to give. Either resistance is taken out and the markets rally sharply, or support is taken out and we fall sharply. I think we are still in a Bear Market, so I am not invested in stocks and don’t care which way we go. I can make money in either direction. I just want a strong trend!
If resistance is taken out, then I want to own QQQQ. I will put in Stop Orders to Buy above $30.50.
I expect the first move out of this range to be a headfake and would not be surprised to see the market start in one direction to trigger a bunch of trades and then reverse sharply to trigger a bunch of stop losses to accelerate the real move. Yes, Market Makers do such things.

The inverse of the NASDAQ 100 Index is PSQ. If the uptrend from the lows is broken on QQQQ, then I want to buy PSQ. I will have stop orders in above the PSQ Green Line.

One thing to watch out for is that if support is broken, then I would expect CNBC to float a rumor that the government is going to announce a bailout after the close on Friday. Gasparino will be the guy who does it, if it happens – “My sources are telling me (blah), (blah), blah)…”
Here is the hourly on QQQQ. QQQQ was extremely oversold on 11/21 (Pink Circle). It was 2.5 Standard Deviations from its hourly norm. This is a rare occurrence and a normal place at which to look for a reversal. QQQQ closed right on the norm today (Black Arrow).
QQQQ is actually pretty oversold on the hourly chart (Blue Box and Arrow) and could just sit around here for a few hours on Friday before breaking down. It could also just ramp and be at $32 before you can blink. We’ll see how it goes. In a week, I could be telling you that we are still stuck in the $29.5 range... I need to take what the markets give me.

Crude Oil (USO)
The other potential set up is a reversal in the price of Crude Oil. I use the ETF USO for investing in Crude Oil.
USO has traded from $119.17 to $32.10 in 5 months. The last 2 days have seen MASSIVE volume (Arrows). I always get interested when volume explodes, because it often occurs at the end of a move. So, I am looking for a potential reversal.
Here is the hourly chart on USO. The setup is there for a panic bottom. See how Momentum (bottom of chart) is putting in a higher low (Blue Line and Arrows), while price is putting in a lower low (Green Line).
On a panic bottom, big money stops selling on the first bottom (Green Arrow) and the little guy gets shaken out on the final panic bottom (potentially today’s bottom).

The setup I will be looking for is a reversal in price back above $33.25. That would give USO a chance to start a major short squeeze, where all the people who went short on the break of $33 are forced to cover, while others are buying USO.
See how the norm is at $44? There is not a lot of resistance until $40. I’d be happy with $35…
Friday and Monday could have some serious fireworks!

The inverse of the NASDAQ 100 Index is PSQ. If the uptrend from the lows is broken on QQQQ, then I want to buy PSQ. I will have stop orders in above the PSQ Green Line.

One thing to watch out for is that if support is broken, then I would expect CNBC to float a rumor that the government is going to announce a bailout after the close on Friday. Gasparino will be the guy who does it, if it happens – “My sources are telling me (blah), (blah), blah)…”
Here is the hourly on QQQQ. QQQQ was extremely oversold on 11/21 (Pink Circle). It was 2.5 Standard Deviations from its hourly norm. This is a rare occurrence and a normal place at which to look for a reversal. QQQQ closed right on the norm today (Black Arrow).
QQQQ is actually pretty oversold on the hourly chart (Blue Box and Arrow) and could just sit around here for a few hours on Friday before breaking down. It could also just ramp and be at $32 before you can blink. We’ll see how it goes. In a week, I could be telling you that we are still stuck in the $29.5 range... I need to take what the markets give me.

Crude Oil (USO)
The other potential set up is a reversal in the price of Crude Oil. I use the ETF USO for investing in Crude Oil.
USO has traded from $119.17 to $32.10 in 5 months. The last 2 days have seen MASSIVE volume (Arrows). I always get interested when volume explodes, because it often occurs at the end of a move. So, I am looking for a potential reversal.

Here is the hourly chart on USO. The setup is there for a panic bottom. See how Momentum (bottom of chart) is putting in a higher low (Blue Line and Arrows), while price is putting in a lower low (Green Line).
On a panic bottom, big money stops selling on the first bottom (Green Arrow) and the little guy gets shaken out on the final panic bottom (potentially today’s bottom).

The setup I will be looking for is a reversal in price back above $33.25. That would give USO a chance to start a major short squeeze, where all the people who went short on the break of $33 are forced to cover, while others are buying USO.
See how the norm is at $44? There is not a lot of resistance until $40. I’d be happy with $35…
Friday and Monday could have some serious fireworks!
Now, off to yet another Holiday Party or recital or something festive...
Wednesday, December 17, 2008
Why Isn't Energy Rallying?
After a sharp, 6-day rally, Crude Oil fell 7% today. The excuse is that OPEC cuts to Oil production were below expectations. I wanted to take a look at Commodities and Commodity-related sectors. I wanted to do so, because I keep hearing people on TV talk about how great the likes of Dry Ships (DRYS) and Chesapeke Energy (CHK) look.
I keep hearing the same words they were throwing around when they talked about Financial stocks – “Value”, “Cheap”, “Oversold”, “Bottom”… Bottoms will form over time and there is no need to jump in until institutions prove that they are looking to buy as well.
Bubbles Cause Mal-Investment
My thesis is that there is a massive supply of Oil now sitting in Oil Storage Facilities and parked in Super Tankers off many major ports. This supply is now competing directly with OPEC for a presently-diminishing number of consumers. So it doesn't really matter how much OPEC cuts supply in the near term, because there is ample supply available, without having to take any more oil out of the ground. At some point, this dynamic will change and I will be interested in OIl when it does.
The last phase of the 2002-2007 Bull Market was the bubble in Commodities and Energy. This bubble popped in early- to mid-2008. Here is a chart of the Energy Stock ETF (IYE). Look at how many shares of IYE were traded in the 1st half of 2008 (Green Box).

That was massive speculation, with buyers stepping all over each other to load up on Energy holdings. I think a lot of this was the result of Hedge Funds being allowed to lever up 6:1 or 10:1 and ramp up energy prices. West Texas Crude Oil ($WTIC) and Natural Gas ($NATGAS) went straight up.


So did Agricultural Commodities ($DJAAGT).
This was a classic bubble, where people all tried to chase returns and in the end, there was nobody left to buy. Then, the inevitable Crash soon followed.
Futures Deliveries
Because Futures Contracts ultimately end in the delivery of the underlying commodity to the owner of the contract, somebody has to figure out how to store the commodities they buy. What ended up occurring in the Commodity Bubble, was that Hedge Funds and large Investment Banks bought storage facilities and oil tankers to store their oil.
This stuff never made it into the economy – it was sitting in the SS Harvard Endowment Supertanker in the South China Sea, waiting to be sold at some future date, at some higher price.
When the bubble popped, there were no more speculators to sell to and now massive excess supply existed. The owners then started selling to consumers. So you now had this fleet of Oil Tankers and Cargo Ships full of Raw Materials, sitting in the harbors of the World’s major cities.
This excess supply led to price implosions and also led to implosions in the business of companies who make their money shipping raw materials – Shippers ($BDI), Pipelines ($DJUSPL) and Railroads ($DJUSRR).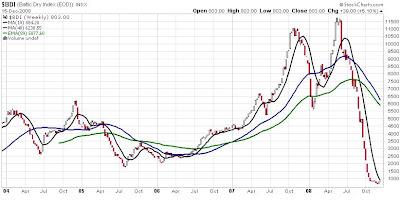


The moral to the story is this – don’t go buying these sectors because some guy on TV is telling you that they are cheap. Be patient. The bottoms will take time. But they will eventually bottom and may become leaders again.
Remember how they looked at the top, because the cheap money now being printed by Central Banks is going to set up a new series of bubbles. There will come a time to buy these and then another time to sell these. I will let you know when these times arrive.
For now, here is the Energy Index (IYE). It has been consolidating for 11 weeks on contracting volume. Remember, consolidations are followed by violent moves. I expect a big move soon. I am not sure in which direction it will move, but I think I can make money on it when it arrives.
I keep hearing the same words they were throwing around when they talked about Financial stocks – “Value”, “Cheap”, “Oversold”, “Bottom”… Bottoms will form over time and there is no need to jump in until institutions prove that they are looking to buy as well.
Bubbles Cause Mal-Investment
My thesis is that there is a massive supply of Oil now sitting in Oil Storage Facilities and parked in Super Tankers off many major ports. This supply is now competing directly with OPEC for a presently-diminishing number of consumers. So it doesn't really matter how much OPEC cuts supply in the near term, because there is ample supply available, without having to take any more oil out of the ground. At some point, this dynamic will change and I will be interested in OIl when it does.
The last phase of the 2002-2007 Bull Market was the bubble in Commodities and Energy. This bubble popped in early- to mid-2008. Here is a chart of the Energy Stock ETF (IYE). Look at how many shares of IYE were traded in the 1st half of 2008 (Green Box).

That was massive speculation, with buyers stepping all over each other to load up on Energy holdings. I think a lot of this was the result of Hedge Funds being allowed to lever up 6:1 or 10:1 and ramp up energy prices. West Texas Crude Oil ($WTIC) and Natural Gas ($NATGAS) went straight up.


So did Agricultural Commodities ($DJAAGT).

This was a classic bubble, where people all tried to chase returns and in the end, there was nobody left to buy. Then, the inevitable Crash soon followed.
Futures Deliveries
Because Futures Contracts ultimately end in the delivery of the underlying commodity to the owner of the contract, somebody has to figure out how to store the commodities they buy. What ended up occurring in the Commodity Bubble, was that Hedge Funds and large Investment Banks bought storage facilities and oil tankers to store their oil.
This stuff never made it into the economy – it was sitting in the SS Harvard Endowment Supertanker in the South China Sea, waiting to be sold at some future date, at some higher price.
When the bubble popped, there were no more speculators to sell to and now massive excess supply existed. The owners then started selling to consumers. So you now had this fleet of Oil Tankers and Cargo Ships full of Raw Materials, sitting in the harbors of the World’s major cities.
This excess supply led to price implosions and also led to implosions in the business of companies who make their money shipping raw materials – Shippers ($BDI), Pipelines ($DJUSPL) and Railroads ($DJUSRR).


The moral to the story is this – don’t go buying these sectors because some guy on TV is telling you that they are cheap. Be patient. The bottoms will take time. But they will eventually bottom and may become leaders again.
Remember how they looked at the top, because the cheap money now being printed by Central Banks is going to set up a new series of bubbles. There will come a time to buy these and then another time to sell these. I will let you know when these times arrive.
For now, here is the Energy Index (IYE). It has been consolidating for 11 weeks on contracting volume. Remember, consolidations are followed by violent moves. I expect a big move soon. I am not sure in which direction it will move, but I think I can make money on it when it arrives.

Subscribe to:
Posts (Atom)


