
Friday, October 22, 2010
Baidu Resistance Levels
Baidu (BIDU) is nearing its first resistance out of this 19-day trading range.

The Euro Needs To Hold
Because virtually everything is tied to the Dollar, this daily chart of the Euro (6E Z0-D) makes me nervous. Significant support lies above -4% below the current price. A correction like we saw in August cannot be ruled out and may actually be the more likely path right now. The S&P 500 corrected -8% in August. So you know there is significant potential risk right now.

The S&P 500 (ES Z0-D) is still holding daily support.

Yesterday I noted that the S&P 500 broke out of a 7-day trading range but that it had the reversal pattern, so I expected it to pull back. It did pull back, but still remains above daily support. The first real risk of a correction occurs if the uptrend of the last 3-days fails (Pink Line). I know this is micro-managing, but you will see the markets start to fail on the lower time frames first and I don’t want to miss it.

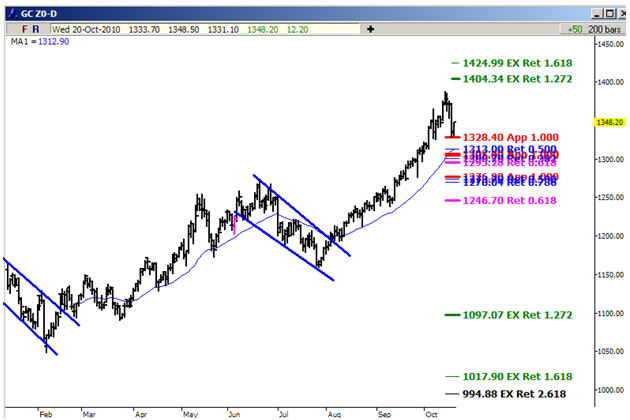
Gold (GC Z0-D) has corrected sharply and is now at potential support. The 30-minute chart currently has Gold at resistance, with the 127% extension at $1,311. So that $1,310 range will need to hold.

You can see the reversal pattern setting up on the Gold Stocks ETF (GDX). Maybe the little 3-hour bounce is all GDX gets, or maybe it becomes something more significant. Regardless, you can clearly see how the uptrend (Blue Line) has broken and how the gap on Tuesday would have caused you to stop out with a -3.5% loss from Monday’s close. Gold seems to make most of its big moves over night, so you are very vulnerable to big losses below your stop losses on GLD and GDX.

I am still very nervously Bullish, but the Euro causes me great concern for a sharp correction at any time.

The S&P 500 (ES Z0-D) is still holding daily support.

Yesterday I noted that the S&P 500 broke out of a 7-day trading range but that it had the reversal pattern, so I expected it to pull back. It did pull back, but still remains above daily support. The first real risk of a correction occurs if the uptrend of the last 3-days fails (Pink Line). I know this is micro-managing, but you will see the markets start to fail on the lower time frames first and I don’t want to miss it.

Gold (GC Z0-D) has corrected sharply and is now at potential support. The 30-minute chart currently has Gold at resistance, with the 127% extension at $1,311. So that $1,310 range will need to hold.

You can see the reversal pattern setting up on the Gold Stocks ETF (GDX). Maybe the little 3-hour bounce is all GDX gets, or maybe it becomes something more significant. Regardless, you can clearly see how the uptrend (Blue Line) has broken and how the gap on Tuesday would have caused you to stop out with a -3.5% loss from Monday’s close. Gold seems to make most of its big moves over night, so you are very vulnerable to big losses below your stop losses on GLD and GDX.

I am still very nervously Bullish, but the Euro causes me great concern for a sharp correction at any time.
Thursday, October 21, 2010
Gold Looks Very Suspect
A few weeks ago I noted that a number of Gold Stocks were in narrow trading ranges and that I was interested in them if they broke out. I noted this, because the most efficient way to manage risk is to have defined levels, which are very close to your purchase price, where you can see supply taking over from demand.
The Gold Stock ETF (GDX) broke out on a long term chart to new weekly highs. It is now in pullback mode. It needs to hold the $54.25 level. Remember, some seriously large losses occur when stocks break out of trading ranges and then quickly reverse lower, through the old breakout point.

The largest holding in GDX is Barrick Gold (ABX), at 16.71%. You can clearly see how it broke out to new highs and then failed by falling back below $48. I got stopped out of ABX before Tuesday’s plunge. ABX now has a bearish wedge forming right below the 50-day (Black Line) – that is very ominous.

Newmont Mining is the 3rd largest holding in GDX, at 11.34%. You can see that it is right on critical support. It had better hold above $60!

Here are a couple “Junior” gold stocks. You can see how dangerous it is if you buy before they break above resistance. In parabolic moves, you still have to figure out how to manage risk!

Gold (GC Z0-D) broke support for the rally since August, so I now have to look at the June-July and December-February corrections to get support levels. I am now concerned that the correction in Gold will be more like what we saw in those multi-month corrections, so I expect this correction to at least take more time than it currently has.
Daily Support Held
Daily support held for the S&P 500 (ES Z0-D). I mentioned earlier in the week that as long as that support zone held, the uptrend was still intact. Now the S&P has broken out of a 60day trading range. You can see on the hourly chart below that it has also set up the reversal pattern (in red), so a pullback to test support would not surprise me. The pullback could only last a few minutes or could take the better part of a day. 1,189 was the 127% target coming of Tuesday’s lows.


Wednesday, October 20, 2010
It Is ALL About The Dollar
Here is the hourly chart comparing the US Dollar (UUP) with stocks ($NYA), Crude Oil (OIL) and Gold (GLD). It is pretty obvious that stocks, commodities and Gold all move inverse to the Dollar. Each Dollar rally has coincided with a pullback or pause in $NYA, OIL and GLD.
The Dollar (UUP) put in a low on 10/14 and the prices of $NYA, OIL and GLD have pulled back. Yesterday there was a big rally in the Dollar and Gold, Crude and stocks got hammered. Today the Dollar is getting pounded and Gold, Crude and Stocks are rallying sharply.

The Fed is in control. The more money they print, the weaker the Dollar gets and the higher asset prices go up. The goal of the Fed is to cause Inflation. Bernanke is a zealot on a mission and nothing is going to stop him from conducting his experiment.
Tuesday, October 19, 2010


Monday, October 18, 2010
iPop?
Apple did their usual, “beating” of expected Quarterly earnings and then lowering expectations for next quarter, only this time the market smoked them. You can see here that Apple rallied right up into resistance today. In after-hours trading it has fallen $18 to $300, so basically it has given up all of Friday’s gains.
The last resistance level was $292 and Apple had a mini “flash crash” off of that level. The event was later blamed on a “rumor”… On a side not, the S&P 500 ETF (SPY) had its own “flash crash” upon Apple’s earnings release, falling 10% in a matter of seconds. Over $500 million in orders were reversed –
http://www.bloomberg.com/news/2010-10-18/nyse-euronext-cancels-trades-of-s-p-500-etf-at-9-6-below-opening-price.html?cmpid=yhoo

IBM also ran too far too fast and is down $5 in after-hours trading.
Microsoft (MSFT) is down too, with a key executive deciding to leave.
My big concern with Apple is that Apple is over 20% of the weighting of the NASDAQ 100 Index and it could have a nasty effect on QQQQ. One day it will fail and it will blow up the market, because it will simply be owned by too many people who all want to sell at exactly the same time – see Intel, Cisco, Microsoft circa 2000.
Markets give clues when things change. Sometimes it is a process, where prices drop, rally back up, drop, rally back up… Markets tend to do this. Stocks and Sectors can literally top in a day. These days are normally the biggest down day ever in price, on the biggest day ever of volume, where price is significantly overbought. October 6th may have been one of those days for a key group – Cloud Computing.
Take a look at some of the leaders from the group – VMWare (VMW), Salesforce.com (CRM), Red Hat (RHT) – the patterns are now tops.
Other former leadershad similar days – F5 Networks (FFIV), Citrix (CTXS), Rackspace Hosting (RAX), Mercadolibre (MELI)

Markets top as leaders break, stock by stock and sector by sector. It is critical to watch how leading names are doing and how they react to earnings this month. On the chart below, I have listed critical support levels for the S&P 500 (ES Z0-D). As long as price holds above these levels, the uptrend remains intact. If price fails to hold these levels, then the possibility opens up for a more substantial correction or top.

Also keep a close eye on the US Dollar, because believe it or not, when Apple tanked this afternoon, the US Dollar spiked higher. Gold, The Euro and The S&P 500 all tanked in unison. It was amazing to watch. The bottom line it this, if Apple has topped, then money had better quickly rotate into other areas.
Fed Keep Pumping Money into Risk
The markets are still rolling, much like the did the last time the Fed decided to print money and dump a bunch of it into the markets each week. This week they will buy Treasuries three times. They already bought $6.3 billion this morning and $4.7 billion last Friday. There will be two more purchases on Wednesday and Friday this week (POMO operations).
The goal of Bernanke is to inflate away the debt that is overhanging the markets. He gave a speech in 1999 where he discusses what monetary policies he would have used to get Japan out of its “lost decade”. There are now on their third “lost decade”. His goal is to give away money, print money and crash the Dollar to get Inflation.
In Bull Markets, whether induced my cheap money or by economic fundamentals, I like to buy leaders on pullbacks. It allows me to buy strength and manage risk.
The latest setup to trigger today was Baidu (BIDU) breaking out of a 17-day consolidation –

Last week there were breakouts in McDonalds (MCD), Oracle (ORCL), Consolidated Edison (ED), Linn Energy (LINE), Insurance (KIE), REITs (IYR) and the NASDAQ 100 (QQQQ). Analog Devices (ADI) and Barrick Gold (ABX) broke back below their breakout levels and stopped me out. I am still interested in them though.

Insurance (KIE) and REITS (IYR) sat around for three week before breaking out and are not both in narrow 4-day trading ranges as they consolidate the gains of last week.

Here is the daily chart of the S&P 500 (ES Z0-D). You can see that there is significant support right below here. If support is violated, then I will be on the lookout for a potentially larger correction. Otherwise, 127% of the April – July selloff is 1,264.

I think Financials are very important to the extension of the current move. If they can join in, then the rally continues to broaden out and get more bullish. But not everything is going to work. You can see that Financials (IYF) tried to break out last week and failed, falling almost 4% in two days. I am watching Financials closely. I will not buy anything extended, because there is simply too much risk here for a quick, sharp selloff.

Bernanke Told You What He Would Do in 1999
In December 1999, Ben Bernanke wrote an essay that discusses the mistakes made in Japanese monetary policy that led to an asset bubble, an asset price crash and then 20 years of deflation and anemic growth. The essay is important, because it goes deep into the thinkings of Bernanke and how he wants to solve the problems now faced by the US economy.
http://www.princeton.edu/~pkrugman/bernanke_paralysis.pdf
According to Bernanke, Japan made a series of “important monetary policy mistakes” –
1) The failure to tighten policy during 1987-89, despite evidence of growing inflationary pressures, a failure that contributed to the development of the “bubble economy”
2) The apparent attempt to “prick” the stock market bubble in 1989-91, which helped to induce an asset-price crash
3) The failure to ease adequately during the 1991-94 period, as asset prices, the banking system, and the economy declined precipitously.
“(I)f the Japanese monetary policy after 1985 had focused on stabilizing aggregate demand and inflation, rather than being distracted by the exchange rate or asset prices, the results would have been much better.”
That the key sentence to Bernanke. He is about “Aggregate Demand”. It is all about inflating away debt.
There are many scary parallels between what occurred in Japan 20 years ago and what has been going on in the US since 2008 –
There has been a crash in Asset Prices (namely Real Estate)
Banks are not lending, because their balance sheets are stuffed with defaulting debts
The Fed has dropped the Fed Funds Rate to basically zero
There is Deflation in a number of areas of the economy
Demand is flat and GDP is flat or down
Money Supply growth is weak, as Banks sit on massive piles of cash
Since the early 1980’s, the US has been able to drive growth by lowing Interest Rates and buying on Credit. Consumer Credit has been contracting since 2008 and Interest Rates have very little room left to fall. Rising Credit is essential to keeping the economy growing and falling Interest Rates are required to drive Asset Prices higher.
We now face a new economic reality and Bernanke has his proposals for how the Government can rescue the economy –
“Commitment to Zero Rate – with and inflation target”
First you announce “that the zero rate will be maintained for some time to come.” This has been done already by the Fed. Then you announce that you will print enough money to have achieve some target level of inflation –
“In particular, a target in the 3-4% range for inflation, to be maintained for a number of years, would confirm not only that the BOJ (Bank of Japan) is intent on moving safely away from a deflationary regime, but also that it intends to make up some of the “price-level gap” created by eight years of zero or negative inflation.
Further, setting a quantitative inflation target now would ease the ultimate transition of Japanese monetary policy into a formal inflation-targeting framework—-a framework that would have avoided many of the current troubles, I believe, if it had been in place earlier.”
The Fed is now talking about targeting a 1-2% inflation rate. The goal of this is to get the anticipated inflation built into prices and make up for the lack of growth in Real Estate prices over the past decade.
“Depreciation of the Yen”
“I believe that a policy of aggressive depreciation of the yen would by itself probably suffice to get the Japanese economy moving again.”
“(T)he BOJ should attempt to achieve substantial depreciation of the yen, ideally through large open-market sales of yen. Through its effects on import-price inflation (which has been sharply negative in recent years), on the demand for Japanese goods, and on expectations, a significant yen depreciation would go a long way toward jump-starting the reflationary process in Japan.”
“In short, there is a strong presumption that vigorous intervention by the BOJ, together with appropriate announcements to influence market expectations, could drive down the value of the yen significantly. Further, there seems little reason not to try this strategy. The “worst” that could happen would be that the BOJ would greatly increase its holdings of reserve assets.”
“Money-financed transfers”
This is how Bernanke got the name “Helicopter Ben” –
“Suppose that the yen depreciation strategy is tried but fails to raise aggregate demand and prices sufficiently, perhaps because at some point Japan’s trading partners do object to further falls in the yen.
An alternative strategy, which does not rely at all on trade diversion, is money-financed transfers to domestic households—-the real-life equivalent of that hoary thought experiment, the “helicopter drop” of newly printed money. I think most economists would agree that a large enough helicopter drop must raise the price level.”
“Surely at some point the public would attempt to convert its increased real wealth into goods and services, spending that would increase aggregate demand and prices. Conversion of the public’s money wealth into other assets would also be beneficial, if it raised the prices of other assets.”
“Money-financed transfers do have a resource cost, which is the inflation tax.” In Bernanke’s mind, Inflation is the goal and not a cost…
“Nonstandard open-market operations”
“A number of observers have suggested that the BOJ expand its open market operations to a wider range of assets, such as long-term government bonds or corporate bonds; and indeed, the BOJ has modest plans to purchase commercial paper, corporate bonds, and asset-backed securities under repurchase agreements, or to lend allowing these assets as collateral (Ueda, 1999, p. 3). I am not so sure that this alternative is even needed, given the other options that the BOJ has, but I would like to make a few brief analytical points about them.
In thinking about nonstandard open-market operations, it is useful to separate those that have some fiscal component from those that do not. By a fiscal component I mean some implicit subsidy, such as would arise if the BOJ purchased nonperforming bank loans at face value, for example (this is of course equivalent to a fiscal bailout of the banks, financed by the central bank). This sort of money-financed “gift” to the private sector would expand aggregate demand for the same reasons that any money-financed transfer does.”
Bernanke actually defines the purchase of “nonperforming bank loans” as a “’gift’ to the private sector”.
“A nonstandard open-market operation without a fiscal component, in contrast, is the purchase of some asset by the central bank (long-term government bonds, for example) at fair market value. The object of such purchases would be to raise asset prices, which in turn would stimulate spending”.
Where We Are Now
The US Government has already –
Dropped short-term Interest Rates to effectively zero
Bought worthless bonds at 100% of their original value
Substantially weakened the US Dollar
Handed out $800 billion in “stimulus”
Told us that low rates are here for a “extended period”
Told us that here is a “inflation target”
So they are following Bernanke’s playbook. The Fed has clearly bought into Bernanke’s game and will print as much money as they have to to create Inflation. They will also use Gold as a lever to force China to unpeg with the Dollar.
Subscribe to:
Comments (Atom)