Thursday, January 6, 2011

Financials at Potential Resistance

Stocks were led higher since December 1st by Financials. The leveraged Financial ETF (FAS) is now at a pretty important price extension. The uptrend does not have to terminate but be on alert for at least a pause in the uptrend.


The inverse of FAZ is FAS. You can see the cluster of support here. If it fails, then support is at $6.65

Wednesday, January 5, 2011

More Market Games

Here’s another example of how this market tries to actively trigger sell orders before moving higher.

On Dec 31st, it barely took out the low at the end of the day. You know guys got stopped out. It then ramped higher on the open Jan 3rd. The Dec 31 low was then marginally taken out yesterday (Orange Arrow). Again, you know people got stopped out.

There’s an investor conference call today to discuss the recent selloff and Cramer told you to buy the stock last night. In my opinion, that dip yesterday (price move, not Cramer) was designed to get people out of the stock. Period…

You Need to Keep Adapting

You need to be able to adapt or will be eaten.

Take a look at Netflix (NFLX) and how it has been trading recently. It’s held the 50-day (Black Line) for months and has been holding a low at $175. Monday it broke below the 50-day and took out the $175 low. The next day it opened above the 50-day on an “upgrade” from a “analyst” and no doubt hosed a bunch of people who got stopped out the day before.

That is today’s market. There is no way that the breakdown was not manufactured. It did exactly the same thing in November and October, breaking support a few days before ripping to the upside.


Here is the chart that I am now using. On it, you can see that there was support at $173 and there was timing on Monday for a low. I did not sell the shakeout. I would have been very upset if I had. NFXL is by no means out of the woods. It needs to clear $182 and then $190 to get the trend back up.

The point of this is now whether NFLX will go up. The point is that you need to use what is working and change as the markets change. How many times now has IBD gone to “Market in Correction” the day the market has bottomed? You need to keep adapting or you will be eaten.

Treasury Top and Dollar Low?

US Treasury Bonds (ZB H1-D) have been trying to find a low since they bottomed in mid-December. There is the potential that the last few weeks have only been a “two-step” rally into resistance and there is now timing for the downtrend to resume.


The currency markets have been moving in lock step with the US Bond market, because rising Interest Rates force money into US Dollars. The Euro (6E H1-D) has timing for a potential high. It needs to clear the 1.353 level to turn the trend back up.


The British Pound (6B H1-D) has a similar setup to the Euro. The 1.5362 needs to hold or another leg down may ensue.


The Canadian Dollar (6C H1-D) has been very strong and actually broke out of a 14-week base last week. It hit first resistance and is now retesting the breakout at 0.9989 Whoever would have thought of Canada as a safe haven currency… Sadly, it’s yielding 0.11%

Monday, December 20, 2010

An Important Week For Bonds

Here is the weekly chart of the 30-year US Treasury (ZB #F-W). It has crashed in recent weeks. There was support at 122, but it was broken this week. Next support is 117’03. If that is broken, then next potential support is 114 and then 106 and 104. Price is very stretched right now on Bonds, so a bounce or pause in the decline cannot be ruled out.

This does look like a nasty Bear Market though, so bounces into resistance will get my attention. The flip side is that these downside levels do not have to be met and any rallied that break through resistance can reverse this pattern to bullish very quickly.


Here is the daily chart of the 30-year US Treasury. You can see where resistance is. If this resistance is cleared, then it votes for a resumption of the uptrend. The 15-minute chart has already turned bullish.


The Vanguard Short-Term Bond ETF (BSV) has hit support, so again, a bounce in bonds cannot be ruled out. A bounce can also turn into a bottom. Those price extension on the 30-year do not have to be met.


I have been saying all along that the Build America Bond (BAB) program would have to be extended. The Municipal Bond market has been hammered on the fact that the BAB extension was not included in the recent tax compromise, but things can reverse quickly in the markets these days.

http://www.bloomberg.com/news/2010-12-17/build-america-bond-program-poised-for-a-reincarnation-house-s-mica-says.html

Let’s see if BAB can break above the 20-day.

An Important Week For Commodities Too

Just as this should be an important week for stocks, it should also be an important week for commodities.

Here is the weekly chart on Gold (GC #F-W). The last 3 major advances were 17, 21 and 20 weeks. Gold is now in week 21 off the last major low. There is a lot of support right below and price extensions above are listed. So far, two price extensions have been met on this rally.

If this is a more important high, then Gold may correct for a few more weeks. We’ll see how it shakes out. If the 20-day gets taken out it will start looking good again. If the 50-day fails, then the correction could get worse.


The daily chart of Gold shows that price is stuck between support and resistance. The 50-day is at 1,369 and the 20-day is at 1,382. Again, this is a very important week for Gold. There are setups in both directions, so expect some chopping around before the trend is established.


Crude Oil (CL G1-D) is in an 11-day trading range, sitting on top of support. Expect a decision soon on Crude Oil and Energy Stocks.


Here is a long-term weekly chart on the Euro (6E #F-W). It is in a downtrend, with support a few points below, but the Euro can get pretty nasty if they want to take it much lower. The Euro has been a good indicator of risk appetite, so I will be watching it closely.

An Important Week For Stocks

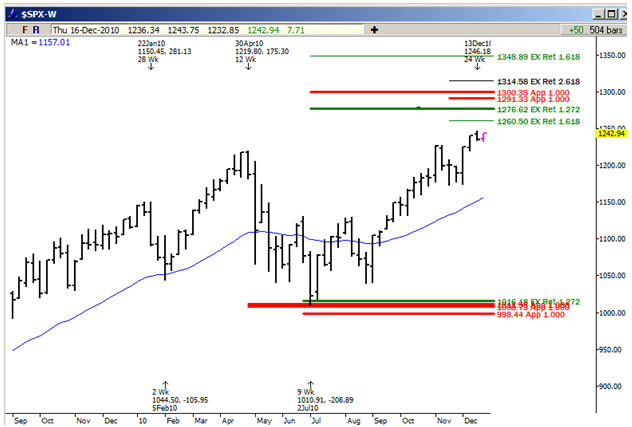
Before I get into the events, here is the weekly chart of the S&P 500 ($SPX). You can see that prices are nearing extensions after a large move. These price levels do not have to be met and they do not have to offer resistance. There is significant timing the first part of January. An overbought market heading into early January would be of significant concern.


Near term, the markets have hit resistance. The NASDAQ 100 (NQ H1-D) has stalled out beneath a price extension the past 7 trading sessions. There is support not far below. The Mid Cap and Small Cap indexes are also sitting in similar trading ranges.


I want to look at the charts of some leading names. I will be doing more of this stalking of leadership next year.

Apple has been holding right above key support for over a week now. It needs to hold $318 or the next support is at $308.


Google has been stuck under a key price extension at $601 for a while. If this zone can be cleared, then things get pretty bullish. If not, then the low near $555 needs to hold.


Priceline has been stuck in a consolidation for several weeks. It needs to hold $389 to keep the uptrend intact. The 50-day is at $389. The 20-day needs to be cleared at $405 before anything good gets rolling.


Netflix is holding key support. There is timing for NFLX on Wednesday.


Amazon has had a shallow pullback into support. It is probably the strongest name right now.


Bank of America rallied into resistance and still remains in a nasty downtrend. Nothing good happens until $13.13 is cleared.


Baidu continues to fail, breaking through support after support. That is a pretty ugly chart.


Intel is camped out on top of key support.


You can see from these charts that this is a potentially significant week for stocks. Many leaders and key indexes are on top of support or stalling out at resistance. They face some pretty important decisions and will probably make them soon. I would love to see an overbought rally into early January to set up potential shorts.