Yesterday, the setup was there to try a short the SPX ETF (SPY) below $113, but the market gapped down about 1% and gave you no reasonable entry point. This morning, SPY gapped down about -1.5%. How many times in the last few weeks has the market opened trading well above or below the close of the previous day, only to reverse sharply and end the day flat?
There was no way to entry shorts today. Very frustrating…
SPX simply blew through support levels and now has turned the trend back down. Here is the hourly chart showing how the gap took price right through the uptrend line and gave you no manageable entry point. I would love to see a rally back into the 15-hour MA (Green Line) that fails.

The next meaningful support is at 1,080 for SPX. That level was hit tonight in the futures market (thanks Cisco) and so far has held. This market has to be taken decision to decision and right now I have to wait for an hourly set up. Remember, these levels get blown through all the time. The idea is to look for reversal patterns are key levels, not take action and hope.

Small Caps, Mid Caps and Equal Weight got absolutely smashed today (-4% was the norm). Here is the chart of the Russell 2000. It is pretty ugly. There isn’t much support below here.

The NASDAQ 100 also had a bad day. Here are the support levels. 1,812 was tested tonight. You can see a little Reverse Triangle pattern set up here with the move below 1,825. I am looking for a reversal from 1,810. I will not buy it, but a weak rally would get me interested.

Semiconductors ($SOX) are on the brink of breaking down. This is the 5th test of the 325 area. The chart has the looks of a 1,2,3 Lower Top. Semiconductors lead the markets. A breakdown here needs to be watched very closely.

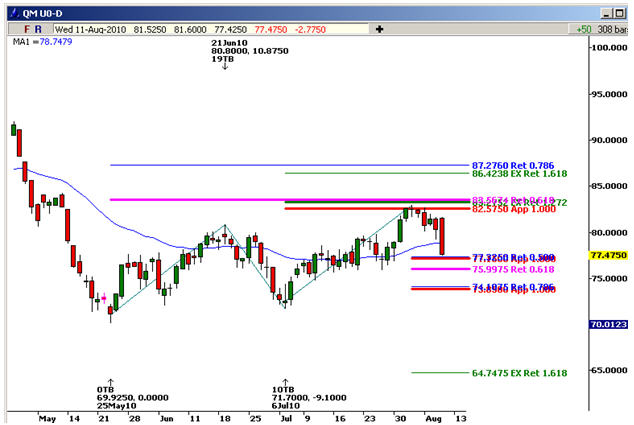
Here is the chart of Crude Oil. It did a two-set pattern up into resistance and has failed. The normal move out of that pattern is to see price extend at least -162% in the other direction. I have been saying for some time now that if Crude breaks $70, then we are in a recession. We should find out very soon if the recession talk is for real.
Gold held up well today. The obvious question about gold is whether or not it will be a risk aversion play here or a victim of deflation? I am hopeful but have my stops in place.

The Euro got smoked today. 1.283 was hit tonight and so far has held.

Here is the hourly on the Euro ETF (FXE). It put in the reversal pattern and rallied back into the middle of it, like I would expect it to. But how are you supposed to enter it? The high was hit on Friday. Then on Monday, the uptrend held. You would like to short FXE breaking the uptrend line, but that was unrealistic when FXE gapped down Tuesday morning over 1% below Monday’s close. Today, it gapped down 1.8% below yesterday’s close. A perfect set up if you can trade futures at 2 am…

I want to see bounces. The weaker they are, the more ominous the tone for the markets. I just hope that the bounces haven’t exhausted themselves by the time the markets open tomorrow morning.
No comments:
Post a Comment