My goal today was to wait for the market to trade in these consolidation patterns and then buy or short the market based on how the market moved.
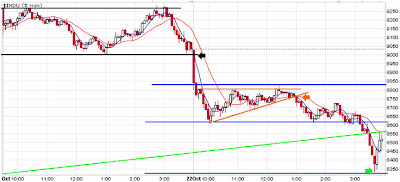
Here is a chart of the Dow Jones over the past two days -
The consolidation of 10-21 was taken out of play, because when the Dow started trading on 10-22, it opened -200 points lower than it closed on 10-21. I closed out my positions in DXD and DUG quickly, because I thought the markets would have a bigger bounce from 8,833 (top Blue Line) than actually materialized.
The Dow hit the 61.8% retracement line at 8,620 and then spent most of 10-22 trading between the two blue lines. The triangle pattern formed and I chose to short the market on a break of the triangle (Orange Arrow). I figured that a test of the green line would materialize on 10-22 or 10-23, and was willing to wait for it to do so. However, I got a bonus in that the selling carried all the way down to 8,335 (Green Arrow)!
I was able to cover some of my shorts, but the market rallied up 250 points in 12 minutes and I was not able to get all my shorts covered in those few minutes when I really liked the prices I was getting.

I shorted the market via the following at about 1:10 pm EDT -
-200% Inverse Emerging Markets – EEV at $150.5
-200% Inverse Financials – SKF at $142
-200% Inverse Materials – SMN at $85.5
-200% Inverse S&P 500 – SDS at $87.50
Here is a daily chart of the Dow. Two things stick out –
1. At some point price will catch up to the black line. It always does. The question is does price rally sharply to touch the line, does the line implode lower to catch price or do they meet somewhere in the middle?
2. The Dow is in a 2,200-point triangle (Green Lines). This is a classic consolidation after a 3,000 point selloff. A break of this pattern would target 6,300 on the downside. Holy cow! I do not make price target predictions. I am just trying to give you an idea of the potential magnitude of the next move.

I am not certain which way the Dow breaks (up or down), but I am fairly confident that it will move up or down with tremendous violence in the not too distant future.
I want in on that move!!
No comments:
Post a Comment