
Friday, October 22, 2010
Baidu Resistance Levels
Baidu (BIDU) is nearing its first resistance out of this 19-day trading range.

The Euro Needs To Hold
Because virtually everything is tied to the Dollar, this daily chart of the Euro (6E Z0-D) makes me nervous. Significant support lies above -4% below the current price. A correction like we saw in August cannot be ruled out and may actually be the more likely path right now. The S&P 500 corrected -8% in August. So you know there is significant potential risk right now.

The S&P 500 (ES Z0-D) is still holding daily support.

Yesterday I noted that the S&P 500 broke out of a 7-day trading range but that it had the reversal pattern, so I expected it to pull back. It did pull back, but still remains above daily support. The first real risk of a correction occurs if the uptrend of the last 3-days fails (Pink Line). I know this is micro-managing, but you will see the markets start to fail on the lower time frames first and I don’t want to miss it.

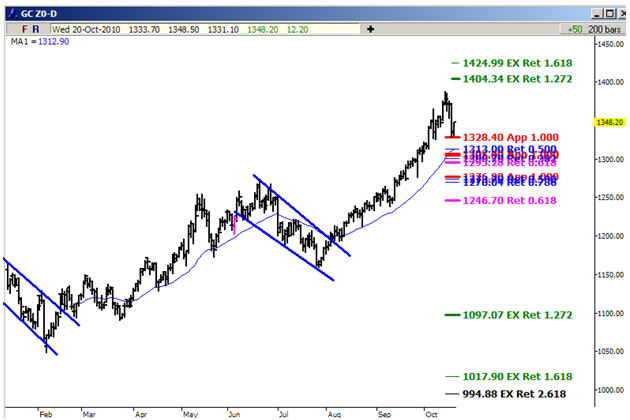
Gold (GC Z0-D) has corrected sharply and is now at potential support. The 30-minute chart currently has Gold at resistance, with the 127% extension at $1,311. So that $1,310 range will need to hold.

You can see the reversal pattern setting up on the Gold Stocks ETF (GDX). Maybe the little 3-hour bounce is all GDX gets, or maybe it becomes something more significant. Regardless, you can clearly see how the uptrend (Blue Line) has broken and how the gap on Tuesday would have caused you to stop out with a -3.5% loss from Monday’s close. Gold seems to make most of its big moves over night, so you are very vulnerable to big losses below your stop losses on GLD and GDX.

I am still very nervously Bullish, but the Euro causes me great concern for a sharp correction at any time.

The S&P 500 (ES Z0-D) is still holding daily support.

Yesterday I noted that the S&P 500 broke out of a 7-day trading range but that it had the reversal pattern, so I expected it to pull back. It did pull back, but still remains above daily support. The first real risk of a correction occurs if the uptrend of the last 3-days fails (Pink Line). I know this is micro-managing, but you will see the markets start to fail on the lower time frames first and I don’t want to miss it.

Gold (GC Z0-D) has corrected sharply and is now at potential support. The 30-minute chart currently has Gold at resistance, with the 127% extension at $1,311. So that $1,310 range will need to hold.

You can see the reversal pattern setting up on the Gold Stocks ETF (GDX). Maybe the little 3-hour bounce is all GDX gets, or maybe it becomes something more significant. Regardless, you can clearly see how the uptrend (Blue Line) has broken and how the gap on Tuesday would have caused you to stop out with a -3.5% loss from Monday’s close. Gold seems to make most of its big moves over night, so you are very vulnerable to big losses below your stop losses on GLD and GDX.

I am still very nervously Bullish, but the Euro causes me great concern for a sharp correction at any time.
Thursday, October 21, 2010
Gold Looks Very Suspect
A few weeks ago I noted that a number of Gold Stocks were in narrow trading ranges and that I was interested in them if they broke out. I noted this, because the most efficient way to manage risk is to have defined levels, which are very close to your purchase price, where you can see supply taking over from demand.
The Gold Stock ETF (GDX) broke out on a long term chart to new weekly highs. It is now in pullback mode. It needs to hold the $54.25 level. Remember, some seriously large losses occur when stocks break out of trading ranges and then quickly reverse lower, through the old breakout point.

The largest holding in GDX is Barrick Gold (ABX), at 16.71%. You can clearly see how it broke out to new highs and then failed by falling back below $48. I got stopped out of ABX before Tuesday’s plunge. ABX now has a bearish wedge forming right below the 50-day (Black Line) – that is very ominous.

Newmont Mining is the 3rd largest holding in GDX, at 11.34%. You can see that it is right on critical support. It had better hold above $60!

Here are a couple “Junior” gold stocks. You can see how dangerous it is if you buy before they break above resistance. In parabolic moves, you still have to figure out how to manage risk!

Gold (GC Z0-D) broke support for the rally since August, so I now have to look at the June-July and December-February corrections to get support levels. I am now concerned that the correction in Gold will be more like what we saw in those multi-month corrections, so I expect this correction to at least take more time than it currently has.
Daily Support Held
Daily support held for the S&P 500 (ES Z0-D). I mentioned earlier in the week that as long as that support zone held, the uptrend was still intact. Now the S&P has broken out of a 60day trading range. You can see on the hourly chart below that it has also set up the reversal pattern (in red), so a pullback to test support would not surprise me. The pullback could only last a few minutes or could take the better part of a day. 1,189 was the 127% target coming of Tuesday’s lows.


Wednesday, October 20, 2010
It Is ALL About The Dollar
Here is the hourly chart comparing the US Dollar (UUP) with stocks ($NYA), Crude Oil (OIL) and Gold (GLD). It is pretty obvious that stocks, commodities and Gold all move inverse to the Dollar. Each Dollar rally has coincided with a pullback or pause in $NYA, OIL and GLD.
The Dollar (UUP) put in a low on 10/14 and the prices of $NYA, OIL and GLD have pulled back. Yesterday there was a big rally in the Dollar and Gold, Crude and stocks got hammered. Today the Dollar is getting pounded and Gold, Crude and Stocks are rallying sharply.

The Fed is in control. The more money they print, the weaker the Dollar gets and the higher asset prices go up. The goal of the Fed is to cause Inflation. Bernanke is a zealot on a mission and nothing is going to stop him from conducting his experiment.
Tuesday, October 19, 2010


Subscribe to:
Posts (Atom)