It is clear that the computers rule the Markets and the little guy is simply along for the ride.
The Markets got hammered overnight, opened way down, then caught a bid around mid day and finished things off relatively flat.
Fading rumors and key moving averages was the name of the game today.
Apple is going to split – maybe…
China is going to buy all the Gold being sold by the IMF – maybe…
The Apple rumor was the excuse to start buying SPX Futures. They light up like a pinball machine. There was $9 billion in purchases in ten minutes. The odd thing is that there was no buying of the SPY ETF to justify the massive Futures activity. But that has been the norm recently. The same thing happened yesterday morning at the beginning of Bernanke’s testimony – I guess nobody thought he was going to keep Interest Rates low…
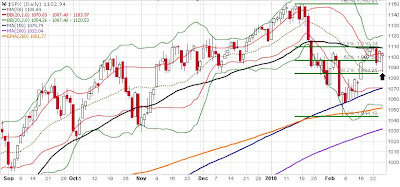
The Fed knows how to play the Markets at key technical levels. Greenspan was a master at trading the technicals. There were several key technical levels hit this morning on SPX (SPX is the key index to watch for this stuff). Almost to the penny, SPX tagged the 38.2% retracement (1,086.52 versus today’s low of 1,086.02) from the February 5th low to the February 19th high - .
Also, the 20-day moving average for SPX was 1,087.4 and the 38.2% retracement of the January 19th high to the February 5th low is 1,084.95
So today was simply a short-term oversold Market at critical support levels being reversed hard by a bunch of computer models. Does anybody else see the danger to this when all of the computers decide to SELL at the same time?
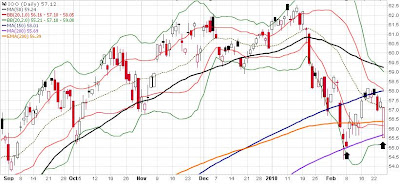
At the same time this was going on domestically, the S&P 100 Global Index gapped down to open below the 200-day average and then spent the rest of the day going straight up.
Does anybody still think that the Markets aren’t being manipulated with intent… Asset Price Appreciation as a policy tool. Keep the rich happy with their stock prices going up, keep the poor happy by extending their unemployment to infinity and stick our kids and their kids with the bill, all while looting the US Treasury for the most politically connect “contributors”.
Markets are still in Correction, but the retest of the February 5th lows is in process and my have ended this morning. I noticed that three sectors broke out of multi-month consolidations today and will be looking to start building positions soon if I get the green light.
Thursday, February 25, 2010
Tuesday, February 23, 2010
Lower Prices Today on Higher Volume
I wrote the following on Friday –
“You can see that SPX is now entering the meat of resistance and that there are some time cycles on Feb 23 and 24. The January 11th high is a pivotal high, because it coincided with a combination of weekly time and price levels. So now you should be looking for a failed retest of the 1,150 range.”
“There is now the potential for a reversal down next week. A reversal down would set up a lower high on the chart and probably set us up for at least a retest of the early February low. We will see if this voodoo triggers. I will look to sell weak areas if it does and then try and add to strength into any Follow-Through Day.”
“Be very careful in here. Many of the pieces are in place for the Markets to reverse lower from here. We will see how things trade, but the setup is there to take prices lower.”
The selling showed up right on cue. Volume increased with today’s selling. The NASDAQ saw its volume increase 22%. Not what you want to see when the selling picks up.
I want to walk you through a couple key stocks, sectors and country-specific ETFs.
Google (GOOG) had a pathetic rally attempt. It hugged the 150-day (Blue Line) and sold off on rising volume today.
Amazon (AMZN) could not even bounce. The best it could do is sit in a narrow trading range. You know what happens if the bottom of the range gets taken out on big volume…
Critical support on Apple (AAPL) is obvious. The $188 range has been tested four times since October. All Apple has been able to do is rally up into the 50-day (Black Line) and then sell off today on increasing volume (Red Arrow).
Goldman Sachs (GS) is stuck below ALL key moving averages. The 50-day is now below the 200-day! That is the definition of a Bear market. Notice how GS has been stuck below the 200-day EMA (Orange Line) and is now in a bearish pattern. Today’s reversal was on big volume (Red Arrow). If that green trendline gets taken out, then really bad things could happen for Goldman.
JPMorgan (JPM) is another very important Financial stock. You can see how it has rallied up into old resistance.
Semiconductors were hit hard today. KLA Tencor (KLAC) is a good example of just how bad things look for some of the stocks in this sector. KLAC looks broken and sold off on big volume today. That ain’t grandma selling. That was the big boys getting out today.
China (FXI) looks like a top too. It is stuck below the 200-day EMA (Orange Line) and the 50-day is about to cross below the 200-day. Yikes! Look at the volume on the last two down days (Red Arrows).
Nothing I have shown you is bullish or justifies purchasing anything risky. Markets are still in Correction and there has not been a Follow-Through Day. The next time cycles are around March 5th, so we could be in for another week or so of weakness.
Subscribe to:
Posts (Atom)