From soon to be #2 at the Fed, Janet Yellen today –
http://www.frbsf.org/news/speeches/2010/janet_yellen0323.html
“In light of these continuing headwinds in the financial system, the housing market, and the job market, I expect that the economy will be operating well below its potential for several years. Economists use the term “output gap” to refer to an economy that is operating below its potential. We define potential as the level where GDP would be if the economy were operating at full employment, meaning the highest level of employment we could sustain without triggering a rise in inflation. Obviously, with the unemployment rate so high, we are very far from that full employment level. In fact, the output gap was around negative 6 percent in the fourth quarter of 2009, based on estimates from the nonpartisan Congressional Budget Office, or CBO. That’s an enormous number and it means the U.S. economy was producing 6 percent fewer goods and services than it could have had we been at full employment. In view of my forecast of moderate growth and high unemployment, I don’t expect the output gap to completely disappear until sometime in 2013.
This idea of an output gap has important implications for inflation. We have a tremendous amount of slack in our economy. When unemployment is so high, wages and incomes tend to rise slowly, and producers and retailers have a hard time raising prices. That’s the situation we’re into today, and, as a result, underlying inflation pressures are already very low and trending downward. One simple gauge of these trends comes from looking at the U.S. Commerce Department’s price index for core personal consumption expenditures, which excludes the prices of volatile food and energy products. These prices have risen a modest 1.4 percent over the past 12 months, below the 2 percent rate that I and most of my fellow Fed policymakers consider an appropriate long-term price stability objective. I just predicted that the output gap might not disappear until 2013. If the economy continues to operate below its potential, then core inflation could move lower this year and next. “
She expects deflation over the next two years and no inflation until at least 2013!
The Government is borrowing at a pace of 9% of GDP this year, and growth this year should come in around 3%, or
9% Spending with borrowed money – 6% Output Gap (over capacity) = 3% Growth
What she is telling us is that the Government can print many more trillions of Dollars without worrying about any Inflationary consequences. Put another way, the Fed can keep on letting hedge funds and banks borrow at 0% and lever the money to infinity for at least the foreseeable future.
Thus today’s bonanza in the stock market.
Tuesday, March 23, 2010
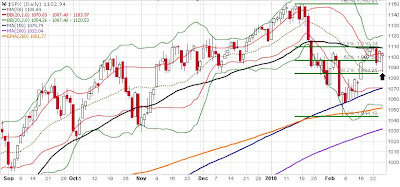
Lots of Breakouts
Leaders have held the 20-day (Green Line) and have popped.
Here is my post mortem on some trades and some potential set ups.
These leaders broke out nicely –


There are many more set up just below resistance and we will see if the big boys move them out as well.
Disk Drives and Semiconductors are leading. I have never seen a time where that was bad.
Look at LRCX holding the 200-day and breaking out of a two-month trading range. KLAC and VSEA are potentially setting up the same way. AMAT looks like LRCX.

I like the looks of Western Digital (WDC – you own it) – holding support and then retaking the 50-day. Watch EMC. I like the gap up out of that big base, off of strong numbers. EMC is just sitting around – “never short a dull market” as the saying goes – hint, hint… JNPR looks similar. CSCO already started moving up today.

The IMF (The US Taxpayer) is going to bail out Greece. That should help to stabilize Europe, but it brings into question the use of the Euro as an alternative to the US Dollar. That will probably mean the EU will have to pay a higher yield to attract capital – time to restart the Dollar Carry Trade!
The Euro (FXE) has a humungous decision to make in the next few days. It is now testing the 61.8% retracement of the November 2008 – December 2009 rally. That’s right, the US Dollar has appreciated 11.1% since December 1st! I have my rules for how to enter. I will be mechanical if they trigger, because this could be a big driver for what goes on in the middle of 2010.

You can plainly see that the Oil Service ETF (OIH) and the Euro ETF (FXE) are highly correlated. The 15-hour EMA (Green Line) is often key support and resistance. If the US is not going to have inflation until 2013 and the Euro zone is paying a higher yield than the US, then the big boys will be looking for exploit the Dollar Carry Trade again at some point.

Let’s see if Commodities will come on line here. A reversal up in the Euro is key. I am watching Copper (JJC) very closely in this multi-week, narrow trading range.

Here is the Canadian Dollar (FXC). It broke out of a multi-month base and has sat around for a few days. Does the chart remind you of EMC or JNPR? A failure back through $97 on volume would not be good and a breakout will be great. Support below $97 is at $93. I am watching FXC closely.
EPP is the ETF for the Pacific Region minus Japan. It is 67% Australia and 30% Hong Kong / Singapore. EPP and FXC have a very close correlation, which tells me that Commodity-based Currencies and Economies have been going nowhere for about six months.

Here is the chart of Occidental Petroleum. It is very similar to the charts of FXC and EPP. Remember, the longer the base, the bigger the move if price can break out. I am watching these asset classes VERY closely.

Sunday, March 21, 2010
Like A Brick Wall
The Dollar hit key support and that night, the PM of Greece started to make noises again about the need for a better bailout and the possibility that the Euro could unravel. Again, this isn’t about telling the future, it is about knowing in advance where to look for potential resistance and support levels, and potential moves like this.
The question now is where is the next support level for UDN (or resistance level for the US Dollar)? Does UDN simply retest $26.4 or does it extend like the move for $28.8 to $27.4 and extend down to a level near $25.6?

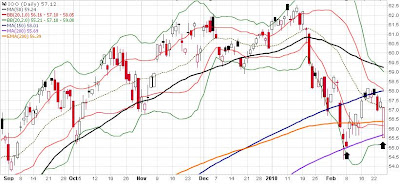
I don’t care so much about currencies, but I am very interested in their impact on Commodity prices, because Commodities have been key leadership – Energy (OIH, XLE), Metals (XME), Gold (GLD, GDX). I will be closely key levels on these areas.
Oil Service (OIH) got hit for about 7% since the Dollar bottomed. Metals (XME) also was hit for about 6%, but is clearly now at key support.

Gold (GLD) is stuck in a three and a half month trading range. Critical resistance is $111.80
Copper (JJC) is now in its forth consolidation since mid-October. 1 & 2 led to nice rallies, while 3 led to a nasty break. There are some obvious support and resistance levels for JJC. Notice how on Monday, JJC cracked, only to see the market gap up hard at the open, to get back above support. Copper is currently up 40 cents over night, so we’ll see what tomorrow brings…

Apple is right above key support ($218.40 - $219.18). It has been sitting around for about 8 trading days, so a big move soon should not be a surprise.

The question now is where is the next support level for UDN (or resistance level for the US Dollar)? Does UDN simply retest $26.4 or does it extend like the move for $28.8 to $27.4 and extend down to a level near $25.6?

I don’t care so much about currencies, but I am very interested in their impact on Commodity prices, because Commodities have been key leadership – Energy (OIH, XLE), Metals (XME), Gold (GLD, GDX). I will be closely key levels on these areas.
Oil Service (OIH) got hit for about 7% since the Dollar bottomed. Metals (XME) also was hit for about 6%, but is clearly now at key support.

Gold (GLD) is stuck in a three and a half month trading range. Critical resistance is $111.80
Copper (JJC) is now in its forth consolidation since mid-October. 1 & 2 led to nice rallies, while 3 led to a nasty break. There are some obvious support and resistance levels for JJC. Notice how on Monday, JJC cracked, only to see the market gap up hard at the open, to get back above support. Copper is currently up 40 cents over night, so we’ll see what tomorrow brings…

Apple is right above key support ($218.40 - $219.18). It has been sitting around for about 8 trading days, so a big move soon should not be a surprise.

Wednesday, March 17, 2010
Key Currency Decision Coming
Currencies are going to make a key decision over the next few days, as the Dollar is now at trendline support. This should have a big impact on Commodities and Commodity-based economies, as it will determine the next leg of the Dollar Carry Trade.
The US Dollar is at key support

The British Pound is at key resistance

UDN is the ETF that moves inverse to the US Dollar. It is effectively a weighted basket of several foreign currencies.
Here is a chart comparing UDN to China (FXI). China peaked in November on the Dubai default scare. The US Dollar bottomed a few days later as money looked to the Dollar for safety. The Dollar sold off and then rallied again in January/February on the Greece scare.
The Dollar has had a mild pullback, as stocks have gone higher over the past month. Now you have FXI and UDN testing the tops of their trends. A decision is near for the next leg up or down for Stocks, Commodities and Currencies.

Here is the ETF for Australia (EWA). You can see that price is little changed since October. But look at the trading pattern – a series of higher highs and lower lows. William O’Neil calls this “wide and loose”, others call it a Reverse Symmetrical Triangle. What it is is a lot of institutional indecision.
This pattern is the lowest common denominator entry point for trend reversals. EWA still has to hit a new high to set up the pattern, and then a sell has to trigger. The pattern may fail and EWA may break out from here, but the setup will be worthy of your attention if you own commodities or stocks.

That is the whole point of this blog. You can’t tell the future, but you can be ready in advance if the setups are there. You have to be! I actually hired a second consultant to help me simplify my money management. His job is to help me distill the market down to key leadership and see stuff like this as it is setting up.
I can’t keep track of 800 companies, but I can observe whether Large is outperforming Small or Domestic is outperforming International. And I can keep track of something as simple as this chart, because #4 was a key buy level and #3 was key short. I don’t need too many of those trades to make my year or miss too many blow my year.
You will see a different tone to this blog. It will be very mechanical – much more simplified. I will do a lot less trading in 2010. I will be waiting for setups like EWA or UDN/UUP and when they trigger, I will commit money with stop losses, in case the market tells me that I am wrong. A chart like EWA gives me a very clear idea of when I should be committing new capital and taking profits.
Here is a chart comparing UDN to Gold (GLD). You can see that Gold is the anti-Dollar. So a breakout in UDN will probably be good for Gold and a breakdown in UDN will probably be bad for Gold. We’ll see how it plays out. I would probably be focusing on GLD on a break above 112.5 if UND can break out. However, if UDN has another leg down, then I will be holding off on new Gold purchases.

The next crisis may be forming. It is a potential trade war with China over the valuation of their currency. Paul Krugman dropped a bombshell on Sunday when he wrote things like the following in the NY Times –
http://www.nytimes.com/2010/03/15/opinion/15krugman.html
“China’s policy of keeping its currency, the Renminbi, undervalued has become a significant drag on global economic recovery. Something must be done.”
“Most of the world’s large economies are stuck in a liquidity trap — deeply depressed, but unable to generate a recovery by cutting interest rates because the relevant rates are already near zero. China, by engineering an unwarranted trade surplus, is in effect imposing an anti-stimulus on these economies, which they can’t offset.”
“It’s true that if China dumped its U.S. assets the value of the dollar would fall against other major currencies, such as the euro. But that would be a good thing for the United States, since it would make our goods more competitive and reduce our trade deficit. On the other hand, it would be a bad thing for China, which would suffer large losses on its dollar holdings. In short, right now America has China over a barrel, not the other way around.”
“The Peterson Institute for International Economics estimates that the Renminbi is undervalued by between 20 and 40 percent.”
“In 1971 the United States dealt with a similar but much less severe problem of foreign undervaluation by imposing a temporary 10 percent surcharge on imports, which was removed a few months later after Germany, Japan and other nations raised the dollar value of their currencies. At this point, it’s hard to see China changing its policies unless faced with the threat of similar action — except that this time the surcharge would have to be much larger, say 25 percent.
I don’t propose this turn to policy hardball lightly. But Chinese currency policy is adding materially to the world’s economic problems at a time when those problems are already very severe. It’s time to take a stand. “
Now you can agree or disagree with Krugman’s logic. That is not the point. The point is that you are now getting key economic figures talking about a trade war with China, where the purpose of the war is to massively devalue the purchasing power of the US Dollar.
I know that the long run path of the US Dollar is lower, because it is the only way to get jobs back home and inflate our debt away. That said, my brother once told me that “markets go to the most logical place, in the most painful manner possible”. So keep an eye on UDN and commodities and stuff like EWA, because a big decision is coming very soon – one way or the other.
Sunday, March 14, 2010
Lehman Repo 105
I don’t know if you have been following this, but the final report on Lehman Brothers’ bankruptcy was released this week and it pretty much affirms the fear that many people have that the banking system is effectively unregulated and banks are allowed to lie about the value of the assets they hold.
The Pawn Shop is Open
Repo 105 was an accounting device used by Lehman to manage its balance sheet, so that it appeared at each quarterly reporting that Lehman had a lower leverage ratio than was actually true. Basically what Lehman did was “sell” assets at the end of the quarter for more than they were actually worth, through complex accounting tricks and then promised to “buy” them back after the quarter closed to bring them back onto the balance sheet. It was done to make it look like they held fewer assets and more cash.
They did it a lot and they did it for years. They were cooking the books. Management got rich, by giving themselves bonuses based on the fraudulent numbers –

What were the regulators doing about it? Stress Tests
They kept running new less-stressful tests until Lehman qualified as a going concern.
These transactions were not disclosed on SEC filings and they were not called into question by Lehman’s auditor. These transactions were only done to misrepresent Lehman’s numbers to the markets.
We all know that this stuff is going on. Think of what Greece was doing, using Goldman to create accounting tricks to make it appear that they were not spending as much as they actually were. Think about states like California, where they are using accounting tricks like pulling revenue in from next year by making you pay 80% of this year’s taxes by June 30th (close of the fiscal year) and pushing spending out until July 1st.
From CNBC last week –
http://www.cnbc.com/id/35768105
“Accounting rules require that banks write down the value of those loans on their books, and experts tell me that if banks really accounted for all the losses in the home loan market, they'd all be insolvent.
That's why the Obama Administration has created this kind of shell game in the first place.
I stole that shell game idea from housing consultant Howard Glaser: "We're spending tens of billions of dollars on a tax credit to get people to purchase homes, we're spending federal money to keep them in their homes through the modification program, and now we're going to pay them to move out of their homes. This is not a sustainable system for the housing market. It's a shell game. Bernie Madoff could have created this system," Glaser told me today.”
How many other banks are pulling this stuff? How many states and countries are using accounting tricks to appear to be solvent?
The only reason Lehman finally blew up is because they finally ran out of good assets to promise. They literally got to a point where they were using assets as collateral with other banks and the banks told them that the collateral had no value. Lehman was asked to promise other securities as collateral and when they could not offer any, there was a run on Lehman and they collapsed.
Heralded author Brian Ritholtz had this to say –
“All in all, the entire system failed. The situation is utterly disgusting, and if the investing public pulls its money out of the completely corrupt public markets for a generation or more, it would not surprise me . . .”
Let’s see if anybody actually goes to jail or has to repay bonuses over this.
Wednesday, March 3, 2010
Gold Priced in Euros at New High, Not Priced in Dollars
Here is a chart comparing the movement of the price of Gold in Euros (Top Chart) and in US Dollars (Bottom Chart). I want to point out a couple things that I see –
Gold moves in fits and starts. It consolidated for much of 2003 – 2004 and then went parabolic in 2005. It sat around for a lot of 2006 and 2007, then had a sharp rally into early 2008. It then had a series of consolidations for much of 2008 and 2009, before going parabolic again into December 2009.
I bought most of my Gold via GLD at about $84 and again at about $88. I sold a third a day before the top (educated luck) and then sold the remainder on the counter-rally towards $115. Some thought that I was nuts for selling, but I sold because I know how gold trades and I didn’t want to be stuck with 30% of my money in an asset stuck in a violent 12 to 18 month trading range.
Now back to the chart –
The Euro has imploded since the Dubai crisis started on December 1st 2009. It gathered steam as it has become clear that the PIIGS (Portugal, Italy, Ireland, Greece and Spain) need to be bailed out by Germany and France.
The flight from the Euro has caused Gold, as price in Euros, to hit an all time high in price. See how the chart has that wedgy, vertical move so far in 2010? Now compare that to how orderly the consolidation has been for Gold priced in US Dollars. The consolidation in the first half of 2009 was also very orderly for Gold.
2010 has been a very difficult environment in which to make money. Normally, in times like these, I would have a lot of money in safe stuff, earning 5% with no risk. But with the Fed holding safe rates at effectively zero, it is not possible right now to get a decent yield on cash.
Now, with all of that said, Gold is at key resistance. Stocks are also at key resistance. There is a cluster of time cycles from March 3 – 9. So you once again have a market at resistance and time at a place where the boys love to reverse trends.
There has been a Follow-Through Day this week for the NASDAQ, but it barely qualified and volume continues to be crappy. I took note that the Follow-Through Day was right at the beginning of these time cycles and right as price was getting into the meat of resistance. Would it surprise anybody to see them suck you in right before they take price down? I also noted that key risk indicators, like Australian Dollar, are not confirming the last two weeks of the rally.
I think the resolution to Greece will force a lot of money back out of the Dollar and Gold and back into the Euro. I also think that the IMF will have to bail out the PIIGS. This is just naked monetization and should be another driver for risky assets.
I am interested in Gold if it can break out of this consolidation, because it is a pretty easy pattern to see and should attract the herd. Any purchase will be a trade only, as it looks like Wave 5 off of the October 2008 bottom. I am tired of using the word “trade”, but I have to, because risk is higher than at any time in my 19 year career.

Thursday, February 25, 2010
Futures-Driven Romp from Key Support Levels
It is clear that the computers rule the Markets and the little guy is simply along for the ride.
The Markets got hammered overnight, opened way down, then caught a bid around mid day and finished things off relatively flat.
Fading rumors and key moving averages was the name of the game today.
Apple is going to split – maybe…
China is going to buy all the Gold being sold by the IMF – maybe…
The Apple rumor was the excuse to start buying SPX Futures. They light up like a pinball machine. There was $9 billion in purchases in ten minutes. The odd thing is that there was no buying of the SPY ETF to justify the massive Futures activity. But that has been the norm recently. The same thing happened yesterday morning at the beginning of Bernanke’s testimony – I guess nobody thought he was going to keep Interest Rates low…

The Fed knows how to play the Markets at key technical levels. Greenspan was a master at trading the technicals. There were several key technical levels hit this morning on SPX (SPX is the key index to watch for this stuff). Almost to the penny, SPX tagged the 38.2% retracement (1,086.52 versus today’s low of 1,086.02) from the February 5th low to the February 19th high - .
Also, the 20-day moving average for SPX was 1,087.4 and the 38.2% retracement of the January 19th high to the February 5th low is 1,084.95
So today was simply a short-term oversold Market at critical support levels being reversed hard by a bunch of computer models. Does anybody else see the danger to this when all of the computers decide to SELL at the same time?

At the same time this was going on domestically, the S&P 100 Global Index gapped down to open below the 200-day average and then spent the rest of the day going straight up.
Does anybody still think that the Markets aren’t being manipulated with intent… Asset Price Appreciation as a policy tool. Keep the rich happy with their stock prices going up, keep the poor happy by extending their unemployment to infinity and stick our kids and their kids with the bill, all while looting the US Treasury for the most politically connect “contributors”.
Markets are still in Correction, but the retest of the February 5th lows is in process and my have ended this morning. I noticed that three sectors broke out of multi-month consolidations today and will be looking to start building positions soon if I get the green light.
The Markets got hammered overnight, opened way down, then caught a bid around mid day and finished things off relatively flat.
Fading rumors and key moving averages was the name of the game today.
Apple is going to split – maybe…
China is going to buy all the Gold being sold by the IMF – maybe…
The Apple rumor was the excuse to start buying SPX Futures. They light up like a pinball machine. There was $9 billion in purchases in ten minutes. The odd thing is that there was no buying of the SPY ETF to justify the massive Futures activity. But that has been the norm recently. The same thing happened yesterday morning at the beginning of Bernanke’s testimony – I guess nobody thought he was going to keep Interest Rates low…

The Fed knows how to play the Markets at key technical levels. Greenspan was a master at trading the technicals. There were several key technical levels hit this morning on SPX (SPX is the key index to watch for this stuff). Almost to the penny, SPX tagged the 38.2% retracement (1,086.52 versus today’s low of 1,086.02) from the February 5th low to the February 19th high - .
Also, the 20-day moving average for SPX was 1,087.4 and the 38.2% retracement of the January 19th high to the February 5th low is 1,084.95
So today was simply a short-term oversold Market at critical support levels being reversed hard by a bunch of computer models. Does anybody else see the danger to this when all of the computers decide to SELL at the same time?


At the same time this was going on domestically, the S&P 100 Global Index gapped down to open below the 200-day average and then spent the rest of the day going straight up.

Does anybody still think that the Markets aren’t being manipulated with intent… Asset Price Appreciation as a policy tool. Keep the rich happy with their stock prices going up, keep the poor happy by extending their unemployment to infinity and stick our kids and their kids with the bill, all while looting the US Treasury for the most politically connect “contributors”.
Markets are still in Correction, but the retest of the February 5th lows is in process and my have ended this morning. I noticed that three sectors broke out of multi-month consolidations today and will be looking to start building positions soon if I get the green light.
Subscribe to:
Posts (Atom)