Saturday, August 22, 2009

“It is pointless to argue with the market… (The Big Picture – IBD 8/21/2009)”

That pretty much sums up my world.

If Big Money is buying, then I need to be as well. I need to be looking for the best setups in the best companies, sectors, asset classes, commodities, currencies, countries. They took a pause for a few weeks and now appear hungry again.

I have not done a lot of posting recently, because I have been spending a lot of time studying and have had more meetings with new clients than I have ever had in my life. Throw a new company on top of that and I simply don’t have time to post much. People still seem to not believe that a recovery is possible, just as they seemed to not believe that The Crash was possible.

When I have posted, it has been a lot of charts of markets and stocks, because that is all that matters – what is working and what is not working. Stop Orders get me in and they get me out if I am wrong. This market has rewarded you for buying right and punished you for buying wrong.

Friday was Options Expiration, so today's move could have simply been designed to suck in money before rolling over again. We'll see. The computers are in control, so there are a lot of overshoots below support to shake you out and above resistance to suck you in. It is simply a part of the new Wall Street Machine…

Here is what I am seeing right now –

Indexes
The markets ran into key resistance (SPX 1,015) in late July and just around for a few weeks. They had every chance to fail, but there was minimal selling. Then the buyers showed up yesterday and broke the markets out of their multi-week trading ranges.

Large Growth (including the NASDAQ – QQQQ) is now at the top of its recent consolidation. Sometimes I have to buy based on chart patterns so that I can better measure my entry points. Small Cap Growth (IWO) has a similar chart.

Sectors
Metals and Mining (XME) are just hanging out. The bigger the consolidation, the more fuel for the ultimate breakout or breakdown.

Large Energy companies (XLE) are at the top of a now 11-month trading range. Oil Service (OIH) is also in a trading range, but has performed better than XLE.

Semiconductors (SMH) have been consolidating the last rally for about a month

Latin America (ILF) is also at the top of this consolidation.

Individual Companies
Red Hat (RHT), BIDU, SOHU and EMC are in Bullish Wedges

CCJ is at the top of a trading range.

Apache (APA) broke out of its 11-month range and has been sitting on top of the breakout for a month.

Teekay (TK) may be breaking out.

Commodities
Crude Oil ($WTIC) is sitting at the top of a trading range. If buyers show up, then that could light the fire under Energy Stocks.

Natural Gas is sitting at the low end of a multi-month trading range.

Gold is in a big consolidation, right below critical resistance at $1,000.

The US Dollar is the key to everything (I will post on this later). The falling Dollar has been the driver for all the risk-assets to move higher (stocks, commodities). This is the Dollar Carry Trade in action. A rise in the Dollar above 80 would most likely tank stocks and crash Emerging Market stock markets. A Dollar breakdown and then we most likely get another huge leg up in stocks and commodities. This is the goal Bernanke…

The Swiss Franc may be re-establishing itself as the non-Dollar Reserve Currency.

Wednesday, August 12, 2009

The Now 15-day Consolidation

The NASDAQ 100 (QQQQ) has spent the better part of the last 15 trading days in a narrow range. I mentioned a week ago that QQQQ had consolidated for 5 days after the mid-July moon shot. We are now is day 15 of this consolidation.

Here is how the consolidation looks on the hourly chart. The Blue lines define the first 5-day consolidation. The Black line is now significant resistance. QQQQ failed to break above it yet again today. You can see how this consolidation has allowed the 20-day average to catch up with price (Red Line). QQQQ hit the Red Line this morning and immediately bounced for over 1% in an hour. I would consider a break above the Black Line to be Bullish, with a stop below $39.


I want to show you a comparison of QQQQ and chart of the Large Cap Growth ETF. You can see that these are very much the same chart. Both are in the midst of some pretty meaningful consolidations. Note how price isn’t breaking down, as it seems that nobody wants to sell here, even with the markets overbought – flip the chart over and it is the crash of last year, where nobody wanted to buy when oversold.


Now here is the chart of the Large Cap Value ETF. This ETF seems to be due for a rest in the very near term. I have recently bought sectors in this Index and avoided much of the Technology exposure of the Growth ETF. These sectors are things like Retail, Financials, Real Estate and Transportation.

I really want to sell some of my holdings in the Transportation ETF (IYT) and roll the money into other areas of Transportation that have recently pulled back – like Fedex (FDX). I may or may not sell IYT, but FDX is catching my attention again.


Retail has broken out above $82 and I would like to see it pull back into the $82 range again. But look at how ARO (Areopostale) has been coiling for about a month, right below the breakout level of $37.50. If Big Money shows up to break ARO, then I am interested in going along for the ride.


There are a ton of areas consolidating and I am hoping to be there when they break out.

Leadership
Financials may be bouncing, but they look like Technology did in the initial bounce of 2003. Leadership this time around has been Technology and Emerging Markets.

There are lots of leaders that have taken a break for a number of days to a number of weeks and I am interested if Big Money shows up to buy them again.


Emerging Markets
Remember how these broke out a few weeks ago? They are now digesting the recent move and I am waiting for the buyers to come back.

Energy
Most of Energy has not yet broken out of its base or has broken out and is now sitting right on top of its base. If money is rotating from sector to sector, then at some point Energy should come into play.


Agriculture


Steel


Gold
Gold is in a 17-month consolidation. In my opinion, it is simply a matter of when Gold works, and not if.


I am overweighted in Gold and Energy. I intentionally avoided Technology after the S&P broke out, confirming the Bull Market. Now, Tech has either paused or pulled back and I am looking for Big Money to stop me in.

I am not recommending anyone buy or sell anything. I am simply going through my thought process. You need to remember that all setups do not work and many that trigger fail miserably. This is a very violent market, and with all of the predatory computers triggering limit orders in Dark Pools, via High Frequency Trading programs, the odds of getting whipsawed are increased to the benefit of the likes of Goldman – and to the detriment of the Average Investor.

Monday, August 10, 2009

Holy Credit Bubble Batman

The US Government added about $500 of debt per American in July.

http://thehill.com/leading-the-news/deficit-grew-by-181-billion-in-july-2009-08-09.html

Now Geithner wants Congress to approve raising the Federal Debt Limit, so that the Government can put the Average American still farther into debt.

http://online.wsj.com/article/SB124970470294516541.html

Here is a chart of the Total US Credit Market Debt as a Percent of US GDP. The chart only runs through March 2009. Notice the spike that drove the “Reagan Revolution”, the spike from 1994 – 2000 that drove the “Clinton Miracle”, the vertical ramp under Bush 42 and the vertical continuation under Team Obama.

Does anybody in their right mind think this is sustainable? You know how politicians think and that they won’t stop until the markets force them to. So the only issue is how big does this number get before it implodes?

Do you see the spike back in 1930 that followed “The Crash”? It is interesting how a vertical expansion of Credit did not cause that Crash. The Government reversed their loose money policies, the chart collapsed and the “Great Depression” extended into 1937-38.

I mention this, because the Fed and Bernanke keep telling us that they will not make the same mistake of tightening credit that was made in 1937. So how high will they launch this number?

If you believe Bernanke, he wants to grow “Aggregate Demand” (the denominator). So this ratio could fall as the economy expands. But we all know that the only thing keeping the economy from collapsing is that the Government printed $2.5 trillion of new money. I believe that the only ways the Government is going to get this ratio back in line is by increasing the GDP via inflation and a falling US Dollar.

If you look at this chart, you see that the real value of money has to be cut by 67%. **** me…

The Bond Market
The mechanism for controlling the idiocy of the Government is the markets. The market for controlling this idiocy is the Bond Market. The Fed decided that it would strategically purchase Bonds in an effort to manipulate this market. This practice is called Quantitative Easing.

Every couple weeks, the US Treasury raises money by selling newly created bonds, bills and notes. The sale of this paper effectively sets Interest Rates. The more bonds the Fed has to buy, the more the market is telling it that rates are too low. Rates should be higher to reflect either risk of default or inflation.

Here is an amazing piece from Chris Martenson. It is he shows that the Fed is rigging the Bond Auctions. We all know that the Fed is buying Treausries. However, what they are also doing is getting the major Brokerage Firms and Banks to buy the bonds at auction, to make it appear as if there is demand for them – so that rates don’t have to go higher. But then a few days after the auction, the Fed buys these newly created bonds from the banks! It is just blatant manipulation. But it allows the Fed to declare that the auctions were a "success".

http://www.chrismartenson.com/blog/fed-buys-last-weeks-treasury-auction/23880

It is just a matter of time until US Treasuries collapse and the US Taxpayer is left on the hook with Trillions of Dollars of newly-refinanced Mortgages and newly-created US Treasuries. The seeds have been sown. This is Indian Summer for the markets. This is the “heyidiot.com” rally on a broad market scale. It will go up and the creation of credit will go up until it doesn’t any more and then it will all implode. Or you believe that the same geniuses who got us into this mess (and got rich doing it) will be the same ones to get us out of it…

Wednesday, July 29, 2009

5-day Consolidation

The US Dollar ($USD) held support and moved higher and Oil ($WTIC) and China ($SSEC) got spanked.

But all and all, this has been a very constructive 5-day pullback.

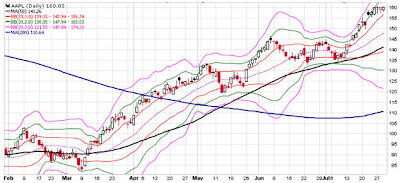
Intel (INTC) is doing exactly what you would want it to do. It went vertical and has since been sitting in a very narrow 5-day trading range. That is called a Bullish Pennant and has the potential to be extremely productive in a very short period of time. Notice how price moved right to rising red line and has held. That is where I expect price to hold. Look for a big, fast move (up or down) in the near term.

The NASDAQ 100 (QQQQ) has a similar pattern and this has me interested in Tech for a potential trade.

Pullbacks to the 50-day
I bought some Microsoft this week on a pullback to the 50-day, because I have seen so many stocks pull back on bad earnings, only to ramp straight back up (see DELL). I also bought some PALM at the 50-day.

Biotech (IBB) has also gone vertical. I expect it to pull an Intel very soon and wait for the Red Line to catch up to price. I am in and not selling.

Look at how Transports (IYT) has simply pulled back toward the old breakout level.

The same goes for OMG and Brazil (EZA).

I am now watching the following closely –
The markets appear to be bottoming like the topped in 2006 -2008. Namely, key sectors are now breaking out of trading ranges and through key resistance, just as key sectors broke down below key support to set up the Bear Market. Remember, the S&P 500 only broke out of its 9-month base last week!

Retail (RTH) has been sitting around at the top of its trading range for the last 5 days. I would love to see it break out from here and play catch up with Biotech and Transports and the S&P 500!

Google (GOOG) has pulled back and is sitting around, right below critical resistance.

Apple (AAPL) looks like Intel. As does Cisco.

The setup is there to go higher. The markets have spent 5 days digesting the moon shot off the failed breakdown. Anything can happen, but I like what I see tonight.

5% Nominal GDP Growth

From Bill Gross at PIMCO today –

http://www.pimco.com/LeftNav/Featured+Market+Commentary/IO/2009/Investment+Outlook+August+2009+Gross+Investment+Potion.htm

“Reflating nominal GDP by inflating asset prices is the fundamental, yet infrequently acknowledged, goal of policymakers. If they can do that, then employment and economic stability may ultimately follow.”

Does that sound familiar? First Greenspan admits it and now Gross.

“…nominal GDP has not only sunk below 5%, but turned at least temporarily negative. If allowed to continue – and this is my critical point – a portion of the U.S. production capacity and labor market will have to be permanently laid off. Nominal GDP has to grow close to 5% in order for the economy’s long-term balance to be maintained.”

Gross discusses how the entire Debt/Leverage-based Economy is built on the assumption of a 5% Nominal GDP growth rate. We are now below that level and the only way to get the consumer spending again is to pump the GDP up with credit. The best way to do that now is to use Government borrowing. Unfortunately (for Gross), that is proving to be politically impossible, so we will just have to live with the consequences of lower growth.

Nonsense. The Fed can print money without a vote being cast by either the Public or an elected official. Therefore, the Fed will keep pumping up credit via leverage of the TARP at the NY Fed and will keep printing money via Quantitative Easing to get back to the magical level of +5% Nominal GDP growth. That means inflation and a falling US Dollar.

Sunday, July 26, 2009

The Dollar Is the Key

Each rally in Stocks has been on the back of a falling US Dollar. I have included a chart below to illustrate this point.

Now, the S&P 500 (SPX) has hit a new rally high, but the Dollar has not hit a new low. The Dollar has a big decision to make here. A break above SPX 950 should be accompanied by a break below 77.5 in the Dollar Index.


The Dollar is now at critical multi-decade support. Failure here should be fuel for another run higher in stocks.

I would expect a break in the Dollar Index to be accompanied by a breakout by Gold.


I have total confidence in the long term devaluation of the US Dollar and the Long Term Bull Market in Commodities, Commodity-based Economies and many Foreign Currencies.

A falling Dollar has been used as a policy tool to ramp stock prices higher. That can last for a while, but at some point, people will lose confidence in the Dollar and pull money from Dollar-denominated Assets.

Friday, July 24, 2009

Spizer Called the Fed a Ponzi Scheme Today on National TV

Dylan Ratigan had on Eliot Spitzer this morning to discuss the Fed’s new effort to grab more power. Here are some of the quotes -

Nothing new if you have been reading my blog, but still refreshing to see it on National TV.

http://www.zerohedge.com/article/ratigan-spitzer-and-toure-clarify-how-fed-operates

Ratigan
“I feel as if America has suffered the greatest theft and cover up, ever. And that the vehicle was where banks created a pile of garbage, that they paid themselves Billions of Dollars of personal compensation and then stuck the Trillions of Dollars of garbage with the American Taxpayer. That to me is stealing.”

The Federal Reserve, using Taxpayer Money, basically becomes a Goodwill Store for the banks. So, the banks take all of their garbage to the Federal Reserve and then like the Goodwill, the banks are then able to write in the value for what they believe the garbage to be worth.” The value is $13.9 TRILLION!!!!!

“We now want to know what’s in this garbage bag, because this garbage bag represents the future of our country.”

Spitzer :“I want to know if there is anything in (the garbage bag) that is worth the money (the banks) have been given. I want to know what you knew it was worth and when you knew what it was worth. If it was zero, why were you doing what you were doing?”

Ratigan :“Congress has asked the Chairman of the Federal Reserve to tell us what is in the bag. What did you give the $13.9 trillion for? “

Spitzer: “We need to ask the hard questions. The most poignant example for me is the AIG bailout, where they gave (over $100 billion) that went right through conduit payments to the Investment Banks that are now solvent. We needed to get the money to the banks. We didn’t get stocks in those banks. They didn’t ask what had been going on.

This begs and cries out for hard, tough examination. The Fed was quasi-autonomous from the public, but it was run by the banks. You look at the governing structure of the NY Fed, it was run by the very banks that got the (AIG) money.

This is a Ponzi Scheme, an Inside Job. It is outrageous. It is time for the Congress to say ‘enough of this’.”

I let a major Wall Street firm because I could add 2 + 2 and see what these banks were doing to the US Taxpayer (present and future). I could not stomach it anymore, so I picked up and left. The move cost me a ton of money and a lot of good will, but my conscience is clean.

There will be hell to pay at some point and the guys who profited from this theft will be strung up. They know this, so they are trying to inflate yet another bubble to allow them time to cover their tracks.

Enjoy the bubble, because it is the last one. This one takes down US Treasury Bonds.