Tuesday, October 26, 2010

Bonds Sold Off When QE1 Started

I want to take a look at Bonds from a big picture level, because so much of the money flowing into risk has been the result of money being printed by the Fed. Here is a chart of the prices of US Treasuries of varying maturities – 30-year ($USB), 10-year ($UST) and 5-year ($USFV) –

What I want to show on this chart is how Treasuries performed during Quantitative Easing 1 (QE1). QE1 started in March 2009 (Green Line) and ended on April 1, 2010 (Red Line). You can see how Treasuries actually sold off as QE1 began, and then sat in a trading range for 11 months. I think this was the result of expectations of economic growth.

Treasuries literally bottomed on the day that QE1 ended. This tells me that the big boys knew that another round of QE would be needed to stave of economic weakness. You can see that Treasury prices shot straight up from April 1st until the next round of Quantitative Easing was announced (QE2) on September 1st.

So the obvious question is do Treasuries now sell off again on expectations of increasing economic activity?


The inverse of Bond Prices is Bond Yields (30-year ($TYX), 10-year ($TNX), 5-year ($FVX) calculate the yields by dividing these by 10). You can see how Bond yield spiked as QE1 started and then sat in a trading range. Yields then imploded as QE1 ended and now may be reversing back up. Past performance doesn’t guarantee future performance, but I am very would not be surprised to see yields rally on expectations or – a) economic growth or b) QE2 will not be as big as some hope it will be.


The US Treasury held an auction yesterday of the 4 ½ year TIP (Inflation-Adjusted Treasury) and the yield on the new TIP was -0.55%. That is right, it had a negative yield. This tells you that the bond market is anticipating Inflation that far outstrips the yield on the non-TIP Treasury with the same maturity.

It is the first time in history that the TIP has had a negative yield in an auction. With Bernanke now instructing the Fed to target 2% (more like 3-4%) Inflation, people are willing to take a loss to get better long-term yields. I think the negative yield is a bit of an overshoot and may mark a low point for yields.

Here is the daily chart of the US Treasury (ZB Z0-D) with support and resistance levels included. You can see that the Treasury has had a decent pullback. It is in a downtrend and testing support.

Monday, October 25, 2010

Support Levels

Hourly resistance held and now it is time to looks for support levels to hold. This is the hourly S&P 500 chart (ES Z0-60min), showing failure at timing. Support shows up in the 1172-177 range.


Here is the S&P 500 daily chart (ES-Z0-D). Support is in the 1166-1172 range. As long as that support area holds, the rally remains intact. A break below 1155 is potentially a serious problem.


You can see that the Dow (YM Z0-240min) hit the 127% extension almost to the penny and has reversed back down. This occurred as other indexes were also hitting upside targets and had timing for a reversal.

I have listed the support levels for the Dow.

Overnight Bounce Stalling?

There was a big spike higher in the futures that took the S&P 500 into upside targets (1189). This occurred with the daily chart for the S&P 500 (ES Z0) entering a timing zone. We have also entered a zone on the hourly chart (ES Z0-60min). You move to the lower timeframes to anticipate turns on the longer-term charts. So far, these daily timing zones have only led to small pullbacks or short pauses in the advance, but the rallies in risky assets are getting extended and some are starting to falter.


The collapsing Dollar is causing risky assets to go up. The Euro (6E Z0) has been a primary beneficiary. The Euro is stuck at the 1.40 resistance level. The overnight rally in the stalled and now the Euro is in pullback mode. Here are support levels. These need to hold, or they open up the possibility of a pretty nasty decline on the daily chart (levels posted on Friday). The Euro is a key indicator for how risky assets move.


Gold (YG Z0-D) bounced hard overnight and has held daily support in the $1,300 range. It needs to clear the $1,360 level to turn the trend back up and then the 127% extension is $1,407. I included the short term support levels below.


Friday, October 22, 2010

Baidu Resistance Levels

Baidu (BIDU) is nearing its first resistance out of this 19-day trading range.

The Euro Needs To Hold

Because virtually everything is tied to the Dollar, this daily chart of the Euro (6E Z0-D) makes me nervous. Significant support lies above -4% below the current price. A correction like we saw in August cannot be ruled out and may actually be the more likely path right now. The S&P 500 corrected -8% in August. So you know there is significant potential risk right now.


The S&P 500 (ES Z0-D) is still holding daily support.


Yesterday I noted that the S&P 500 broke out of a 7-day trading range but that it had the reversal pattern, so I expected it to pull back. It did pull back, but still remains above daily support. The first real risk of a correction occurs if the uptrend of the last 3-days fails (Pink Line). I know this is micro-managing, but you will see the markets start to fail on the lower time frames first and I don’t want to miss it.


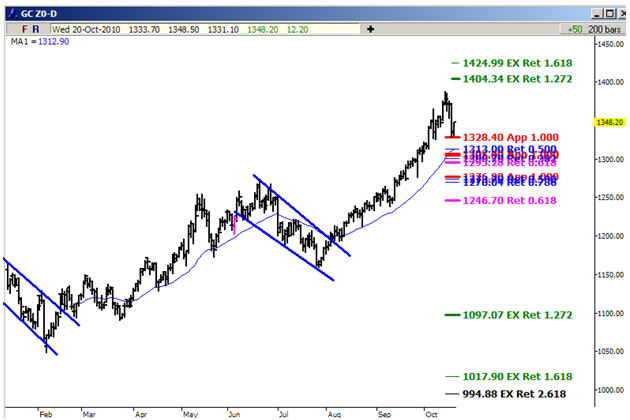
Gold (GC Z0-D) has corrected sharply and is now at potential support. The 30-minute chart currently has Gold at resistance, with the 127% extension at $1,311. So that $1,310 range will need to hold.


You can see the reversal pattern setting up on the Gold Stocks ETF (GDX). Maybe the little 3-hour bounce is all GDX gets, or maybe it becomes something more significant. Regardless, you can clearly see how the uptrend (Blue Line) has broken and how the gap on Tuesday would have caused you to stop out with a -3.5% loss from Monday’s close. Gold seems to make most of its big moves over night, so you are very vulnerable to big losses below your stop losses on GLD and GDX.


I am still very nervously Bullish, but the Euro causes me great concern for a sharp correction at any time.

Thursday, October 21, 2010

Gold Looks Very Suspect

A few weeks ago I noted that a number of Gold Stocks were in narrow trading ranges and that I was interested in them if they broke out. I noted this, because the most efficient way to manage risk is to have defined levels, which are very close to your purchase price, where you can see supply taking over from demand.

The Gold Stock ETF (GDX) broke out on a long term chart to new weekly highs. It is now in pullback mode. It needs to hold the $54.25 level. Remember, some seriously large losses occur when stocks break out of trading ranges and then quickly reverse lower, through the old breakout point.


The largest holding in GDX is Barrick Gold (ABX), at 16.71%. You can clearly see how it broke out to new highs and then failed by falling back below $48. I got stopped out of ABX before Tuesday’s plunge. ABX now has a bearish wedge forming right below the 50-day (Black Line) – that is very ominous.


Newmont Mining is the 3rd largest holding in GDX, at 11.34%. You can see that it is right on critical support. It had better hold above $60!


Here are a couple “Junior” gold stocks. You can see how dangerous it is if you buy before they break above resistance. In parabolic moves, you still have to figure out how to manage risk!


Gold (GC Z0-D) broke support for the rally since August, so I now have to look at the June-July and December-February corrections to get support levels. I am now concerned that the correction in Gold will be more like what we saw in those multi-month corrections, so I expect this correction to at least take more time than it currently has.

Daily Support Held

Daily support held for the S&P 500 (ES Z0-D). I mentioned earlier in the week that as long as that support zone held, the uptrend was still intact. Now the S&P has broken out of a 60day trading range. You can see on the hourly chart below that it has also set up the reversal pattern (in red), so a pullback to test support would not surprise me. The pullback could only last a few minutes or could take the better part of a day. 1,189 was the 127% target coming of Tuesday’s lows.