Monday, May 24, 2010

Euro Panic

IBD wrote the following late last week –

“While the losses in the indexes have been significant since they marked their highs in April, they aren't unusual.

Rebounds from history's nastiest bear markets have involved a huge move up of 50% to 100%, then a significant correction, and finally a second leg up. The average correction was about 21%, the median 19%.

So if this correction proves typical, it may have a bit more to go before the indexes find a bottom, turn up and deliver a follow-through day.

Historically, the second leg up offers a much smaller percentage gain than the first leg. The median gain was 27%.”

O’Neil lays out an idea of how bad things can get. Do they get that bad? Nobody knows for sure, but you can start to be proactive by looking into the internals of the market and identifying what is working and what is not. When you get into periods of weakness, you are better able to see areas of strength.

You can also anticipate key zones and see how markets act in those areas.

Oversold
The Percent of Companies trading above their 50-day MA has fallen to 12%. This is an extreme reading and tells you that the markets can bounce higher at any moment. In the last Bull Market, these extreme readings were buying opportunities and led to nice rallies. However, in the last Bear Market, they only led to bounces or pauses that allowed the markets to work off their oversold conditions before falling to new lower lows.

The obvious question now is does this oversold condition lead to a strong rally or a weak bounce?

The markets are clearly narrowing, with the Bullish Percent now below 50 (Red Arrow), so fewer than half of the NYSE stocks are trading in uptrends. Boy this spike down sure looks like the first Lehman panic in the Summer of 2007…


Strength
Remember, as Bull Markets mature, there are areas of the market that lift prices higher and other areas that hang on for the ride up. Things may be different this time, but history has taught you to focus on the leaders.

Several areas of the market are still holding above their 200-day EMA (Exponential Moving Average). This is the line used by trading services, like Mutual Fund asset allocation newsletters, to determine if stocks are in Bull Markets (Above the Line) or Bear Markets (Below the Line).

The indexes for Small Caps, Mid Caps, The NASDAQ and the S&P 500 Equal Weight are all above their 200-day EMAs.

Sectors like Industrials (XLI), REITS (IYR), Semiconductors (SMH), Retail (RTH), Consumer Staples (XLP) and Consumer Discretionary (XLY) are all above their 200-day EMAs.

Obviously, breaking these levels from here would be very bearish.

Line of Death
The following are barely holding on at support and need to get defended soon or they will put some serious pressure on the Indexes.

The S&P 500, The DJIA, Large Cap Technology (XLK), Basic Materials (XLB) and South Africa (EZA) all have very important support right below current prices. They are below their 200-day EMAs and underperforming leading areas.


Potential Reversal Patterns
I noted the following pattern for Silver (SLV) a few weeks ago –

“Here is the daily chart of Silver (SLV). I have highlighted the expanding price volatility pattern. It looks like a cone. This tells you there is significant indecision in the Institutional Investor camp. Again, this is one of the best reversal entry patterns there are.”

There was an overshoot on the upside, but the pattern played out, with SLV having a nasty correction over the past 7 trading days.


The reason I bring up this pattern, is that it is potentially setting up in many markets, sectors, countries and commodities. They may all fail, but it is worth noting that a very good potential reversal pattern is in place for lots of key stuff.

Keep in mind, than the pattern does not always play out like what occurred with SLV. Sometimes it fails completely, other times the reversal is simply a small bounce or a pause in the current trend. That is why I also wrote the following about SLV that day –

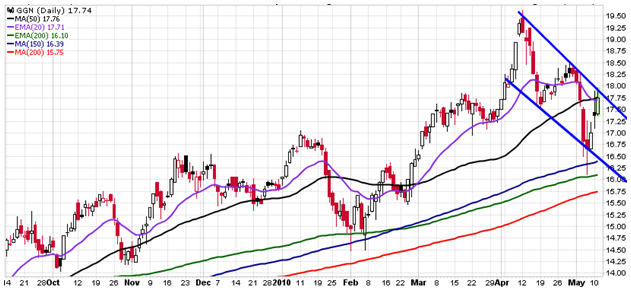
“I would like to see Silver reverse lower from here and give me an entry point near $17.75. If it shows up I may take. If it doesn’t then I will buy pullbacks from higher levels.”

Failures of this pattern have often led to some pretty extreme trends.

Areas with this pattern are The NYSE ($NYA), Energy (XLE), Australia (EWA), Emerging Markets (EEM) and South Korea (EWY).


Potential Tops
As the Bull Market matured in 2006 and 2007, key leadership sectors began to top out and roll over. When the markets would rally to new highs, these areas would not. When the markets would correct, these areas would put in lower bottoms. The following areas look pretty nasty –

Healthcare (XLV), Biotech (IBB), Utilities (XLU), International Developed (EFA), The EU Zone (EZU), Latin America (ILF), Taiwan (EWT), China (FXI) and Brazil (EWZ). The commodities have rolled over with China and those stupid tax laws proposed in Australia, but that could change on any day, and all it would take would be a policy change inside of China to allow for more leverage or some new “stimulus”. So be watching these areas closely for new policy decisions.

Is a 123 Lower Top now in place for Latin America (ILF)? Brazil (EWZ), Europe (EZU, EFA) and Taiwan (EWT) look worse.


Leadership
There are still leading stocks that look great, but they are getting fewer and farther between and their price volatility is incredible.

There are also a number of past leaders that are failing – Google (GOOG), Priceline (PCLN) and Green Mountain Coffee (GMCR) come to mind.

Conclusion
The market fear is similar to the “Panic of 2008. Foreign credit and equity markets are under stress. There has been intervention in the Euro market, and also some short covering, but the US equity market needs all the help it can get from a rebound in the Euro.

It was not a system error when the market tanked last week. The SPX 1055.69 low Fri took out the 2/8/10 1056.51 low close, so that is obviously technical damage, and this is not a normal correction in a bull cycle, but it is a “Euro Zone” panic that is taking the US market along with it.

If the SPX and INDU don`t reverse and hold their 200DEMA`s on the next rally, the market timers and many hedge funds will be forced to reduce allocations even more, which will accelerate the selling and, then the SPX 38.2% Retracement at 1,010 and 50% Retracement 943 will be in play SPX. The bearish hype by the media will snowball it the SPX declines -20% or more, which is the 975 level.

Keep in mind that the June 2009 correction only was 23.6% of the uptrend and the January 2010 correction was 38.2% of its previous uptrend.

Tuesday, May 18, 2010

SPX 1,174 Is The Key

I am of course making the assumption that SPX will get back to 1,174.

The 20-day, 50-day and the high of last week are all at 1,174 (Black Arrow). That makes it critical resistance. It is also the top of this little 8-day trading range.

Notice how the 150-day (Blue Arrows) served as support for both the February panic and this most recent panic (so far).

Barring something nasty, I am going to operate as if the low is in. If there is a high-volume Follow Through Day in the next week or so, I will stop focusing solely on the Index proxies (QQQQ, SPY) and start to focus on high-growth leaders on pullbacks or breakouts.

Sunday, May 16, 2010

We Got Our Pullback...

I wrote the following on Wednesday –

“Prices are now back to the 20-day and 50-day averages. These may offer some short term resistance. Also, 1,160 has been a key price level for SPX. The cycle date is May 15, so there could be a pull back or pause into Friday or early next week.”

The Euro tanked as it became clear that the EU does not want to undertake QE. Instead, they simply want to buy debt from banks, but not increase the overall supply of liquidity. They are truly stupid. The markets don’t like it. This all appears to simply be a power grab designed to make the EU superior to the individual democracies of Europe.

From Ambrose – Evans Pritchard

http://blogs.telegraph.co.uk/finance/ambroseevans-pritchard/100005678/europes-fiscal-fascism-brings-british-withdrawal-ever-closer/

“Fonctionnaires and EU finance ministers will pass judgement on the British (or Dutch, or Danish, or French) budgets before the elected bodies of these ancient and sovereign nations have seen the proposals. Did we not we not fight the English Civil War and kill a king over such a prerogative?

Yet again we are discovering the trick played on our democracies by Europe’s insiders when they charged ahead with EMU, brushing aside warnings by their own staff economists that monetary union was unworkable without fiscal union. Jacques Delors knew perfectly well that this would lead inevitably to a crisis, but it would be the “beneficial crisis” that would force sovereign parliaments to submit to demands that they would never otherwise accept.”

“This is the Gold Bloc fallacy of Continental Europe from 1931 to 1936, the policy that led to Bruning’s destruction of Weimar, Laval’s near destruction of the Third Republic in France with his deflation decrees. It was a precursor to Laval’s fateful role as the Nazi enforcer of Vichy. He was later executed by firing squad, vomitting from a botched suicide with cynanide.

The reactionary character of the EU system is astonishing to behold. Mr Barroso … is becoming a serious danger to civil society and the survival of European democracy. SeƱor Barroso, a decent man, needs to step back and ask himself what on earth is going to be achieved by imposing a deflation death spiral on a large swathe of Europe.”

The Euro
The Euro has fallen from 133 to 123 in just 11 trading days! This is a big-time currency. That is a huge hit. There is a lot of talk that there will be intervention if price falls to the 122 range. 121 is a 50% retracement of the 2000 – 2008 Euro bull market.

The Euro is crashing in a panic, on par with its 2008 crash. The EU has now attained more power than the sovereign nations it represents. If the ECB does not act quickly to calm the panic, then all the power they have attained will be for naught. They will need to step in immediately to calm things down, or all hell will break loose.


You can see here that daily targets have been reached in price.


Gold
Gold has been the panic safe haven. It is running into lots of technical time cycles and has significant resistance less than 3% above here. Funny how all the panic news always seems to happen around key time cycles and price levels, isn’t it…


SPX
The S&P 500 is right above critical support levels. The two main levels are 1,125 and 1,100. I expect those to be heavily defended the next few days. My goal is to always be buying at these key prices, within a few days of these key time cycles. The setup is there. They do not always work. We could go into a full blown crash next week, but I am not so sure how likely that is with the Euro down so much the last few weeks. This is option expiration and should be one crazy week.

Wednesday, May 12, 2010

Will Today Be A Follow-Through Day?

I wrote the following on Monday –

“I wanted to see how today traded before committing all of my money. I took a large position in a US Index proxy (I bought QQQQ) at the open today and will scale into stuff as it breaks out.”

I took another large position (SPY) on the pullback yesterday afternoon. I didn’t sleep well last night, because overnight, the S&P Futures (SPX) kept testing the breakdown point at 1,140. However, when I walked in this morning, SPX was trading at 1,158 and it now trades at 1,170. So I am feeling much better (only tired).

Prices are now back to the 20-day and 50-day averages. These may offer some short term resistance. Also, 1,160 has been a key price level for SPX. The cycle date is May 15, so there could be a pull back or pauseinto Friday or early next week.

I may have jumped the gun by a few days, but this market has not paid you to wait for all of the confirmations you normally want to see. I now have some decent cushion in the QQQQ position and that gives me some flexibility. My biggest fear was that the 4% gap up on Monday would be followed by another one on Wednesday and I would be left in the dust, with no way to make money without taking huge risk, so I took a 20% position in QQQQ at the open on Monday.

Financials (XLF)
This looks like the pullback in January / February – the last Euro Panic. I am not saying that this will rally exactly the same way, but the setup is there if the big boys want to break Financials out and ramp them higher again. The new Euro Bailout was designed to save the banks, so that should bode well for Financials.


Retail (RTH)
Has the same pattern as Financials. That is one incredible chart though. It shows you how volatile price swings are when governments get involved with policies designed to inflate stock prices.


QQQQ has a very similar chart. Let’s see if they can break it out on this move.


Here is the leveraged Gold and Silver Miners CEF (GGN). It has a pretty constructive chart and pays a pretty fat yield. It might file a K-1 (I am not sure) and that may irritate some, but if it makes money while managing risk, then I am willing to put up with a little paperwork…


Gold (GLD) is the talk of the town right now. It is a store of value during inflation and a panic trade haven. The panic trade now is that Germany will leave The Euro… I traded Gold a week ago. Gold is in a buying panic. Here is a chart of Gold versus The Euro. You can see that Gold has broken above the top of the uptrend line from 2008. This is one of my favorite sell signals. Gold may overshoot for a few days or weeks, but the last two corrections were pretty nasty.


Here is the daily chart of Silver (SLV). I have highlighted the expanding price volatility pattern. It looks like a cone. This tells you there is significant indecision in the Institutional Investor camp. Again, this is one of the best reversal entry patterns there are. I would like to see Silver reverse lower from here and give me an entry point near $17.75. It is show up I may take. If it doesn’t then I will buy pullbacks from higher levels.


Finally, here is what my consultant sent me last night –

“The socialist countries will be kept on life support for a while, but there is no intention that they will pay back the debt, so the EU and IMF are really bailing out the banks, which means we are too because the US is a significant part of the IMF funding. This is exactly what our Fed did in 1998 when it got criticized for bailing out the LTCM hedge fund, but it was in reality bailing out the banks without mentioning them by name.

By bailing out LTCM, it was no different than what just happened with AIG, which is not a bank, but it owed the banks big time, so a bailout of AIG was really a back-door bailout of the banks like GS and C etc.

The US is also on a fast track to a debt collapse because our Government [Democrats or Republicans] continue to borrow to cover the exploding deficit and growing entitlements, which end up unfunded, and it has no intention or plan right now to change this death spiral.

A current example of this is the so called financial reform bill which I think will do more harm then good. I mean, how can you not make reforming Fannie Mae and Freddie Mac, and getting it out of the hands of Congress a top priority? Or how about the simple step of restoring the Glass-Steagel Act, repealed at the urging of Bob Rubin, which has proved to be a disaster.

It is all political, and not about what is right for the country. The civil unrest has already started.”

So, my educated guess is that Short Term trends probably favor US Stocks, European Banks, Technology and risk in general, Intermediate Term trends favor Gold, Silver the US Dollar and US Treasuries and Long Term trends favor Gold and Silver.

Monday, May 10, 2010

What A Day

It was obvious that the European Banks who were loaded up on Greek Debt would be the ones to most benefit from the European Bailout. The only variables were when and how low would share prices fall before it happened?

Here is a list of which country’s banks own how much of the outstanding Greek Debt -

France 25%
Switzerland 20%
Germany 15%
US 5%

The CAC (the French version of the S&P 500) was up over 9% today. We were on the brink of the market imploding. To give you an idea of how bad last week was, the CAC is now trading slightly above last Tuesday’ close.

The European Bailout is effectively a mechanism by which the EU and the IMF will print money and use that money to buy the debt of the PIIGS (Portugal, Ireland, Italy, Greece, Spain) owned by European Banks. This is the same game played in the US last year, where the FRBNY created money and used it to buy mortgages from US Banks.

Now the European Taxpayer will be left holding the bag. Make no mistake that this was a monumental crisis. I have to believe that if the EU hadn’t stepped up over the weekend, then next weekend we would be waiting to see which European Banks would end up getting nationalized. The markets are telling you that we were that close to falling into the abyss.

Now if any of the PIIGS default, then the Banking System will not feel a thing. I can’t wait to see how big the bonuses will be next quarter at the European Banks…

I wanted to see how today traded before committing all of my money. I took a large position in a US Index proxy at the open today and will scale into stuff as it breaks out.

I really think that this decision by The EU is a game changer. They will buy $1 trillion of this debt. If you figure that the average bank is leveraged 20 to 1 on assets, then you can see just how much buying power $1 trillion creates. The question now is does the US underperform, as money leaves the safe haven in search of risk? Does Gold underperform with diminished fear, or outperform on increasing Inflation expectations?

I wrote the following last Thursday –

“Everybody knows that the banks of the US and Europe are insolvent and that the only thing keeping them propped up is bs accounting and Government support via the taxpayers purchasing of bad loans. They also know that the only reason asset prices are going up is because of Government-funded leverage and Government-sponsored manipulation of asset prices. It is simply a matter of when, not if asset prices collapse again.

So the EU is left with a couple options, if it does not want a full scale collapse of the Euro Zone Economy –

Start Quantitative Easing. This is when the EU will ultimately print about $2.5 trillion in money to buy these bad loans off the books of the European Banks.”

Here are some performance numbers today for some European Banks. They gapped up to these levels (or higher) overnight, so I was unable to buy them. Don’t get upset that you were not in them on Friday, because if the EU doesn’t blink, then these banks gap DOWN the same percentages this morning.

Some of these I may end up owning.

ING +23%
STD +23%
BBVA +19%
BCS +18%
DB +11%
CS +7%

More to come later today.

What Can You Do...

Credit Suiss (CS) is currently up +10%
Deutsche Bank (DB) is currently up +13.5% pre-market
EAFE (EFA) is up +7% pre-market

I knew what to buy and there isn't a thing I can do about it.

Sunday, May 9, 2010

EU and IMF Go QE in Europe

Europe blinked and did what I figured they would. The EU and the IMF are now promising to make loans and buy almost $1 trillion in sovereign European debt.

That is the EU starting the process of moving the crappy debt on the balance sheets of European banks onto the balance sheets of the European Taxpayer. That is a potential huge win for the shareholders of these banks. Without the bailout, they are out of business - with the bailout, they sell a bunch of worthless Greek debt for Par (100 cents on the Dollar).

Stock Market Futures are up a little over 2% around the World. I will not look a gift horse in the mouth. It used to be that you would buy strength on dips, but now it seems that the crappier the fundamentals and technicals of your holdings, the higher they bounce.

European Banks move to the top of my list - Credit Suisse (CS) and Deutsche Bank (DB)seem to be closest to obvious support.

I am assuming that they bid will come back quickly to Commodities, as $1 trillion is a huge sum of money and it will need to get levered up 5 or 6 to 1 in the near term by these banks, as they start to trade their own accounts with taxpayer money (sound familiar).