I am asked often about who is to blame and who I am voted for. Believe me, there is enough blame to go around to both political parties. So I won’t even touch that subject. These are just my thoughts and you are free to debate them or prove them wrong. I will not be offended. I know I am often wrong and that is why I use stop losses on all trades…
The Glass-Steagall Act was designed to separate the guys who create capital (via leverage) from the guys who create risk. Because what ends up happening is greed takes over as you realize that the more leverage you create, the more profits you make. So the people who are responsible for managing risk get thrown out of the room, because anything they do to impede risk creation costs the bank money.
The Baby Boom
This all starts with the Baby Boom. 30 years ago, the government started enacting policies to prepare the country for the inevitable costs of the Baby Boomers retiring. The costs would be massive increases in entitlements and a substantial decline in consumption. So the government needed to formulate strategies to mitigate the cost of the retirement of the Baby Boom generation.
Replace diminishing Baby Boom Consumption
One goal was to add enough consumers to make up for the declining consumption of a retiring Baby Boom.
On the home front, they did this by opening up the border. How many illegals have received amnesty from Reagan, Bush, Clinton and Bush? Adding 30 or 40 million new consumers is a lot easier than having 30 to 40 million new kids, or outlawing abortion…
On the international front, they wanted to create millions of new middle class consumers in emerging markets. This was done by turning America into a hyper-consumer for the products made in these countries.
Companies move to countries with cheap labor and build manufacturing facilities (the focus is on China, India and the Philippines). Foreign workers have massive savings rates and their surplus savings is recycled back to us via the purchase of US Government debt (more on this later) as foreign governments buy US Treasuries to finance the debt needed to pay for all this excess consumption.
Diminish Entitlement Costs Via Inflation
This was a tricky play initiated under Clinton (Bush has continued it, so don’t get all politicky on this one).
In 1997, the government changed how inflation was calculated so that it could keep the annual Cost of Living Adjustments (COLA) on benefits artificially low. By definition, this decreases the real cost of entitlement programs versus inflation each year.
COLA is running at about 5% less per year than it should be. Check the chart titled “Alternate CPI Measures” here. Notice how annual difference between the “Pre-Clinton Era CPI” and the “Official CPI” –
http://www.shadowstats.com/charts_republish#cpi
Think about what this allows the government to do. It allows them to effectively CUT inflation-adjusted future Social Security benefits, without having to admit it or be forced to vote on it. Sneaky, but needed…
Bubbles
Credit driven asset bubbles were the engine to drive the consumption train.
Y2K
The first big effort to drive the expansion of the middle class in emerging markets was the Tech Bubble. The Tech Bubble was financed by the government under the pretext of getting everybody prepared for Y2K. Cheap money was provided to companies, leading to lots of unprofitable businesses and massive over-capacity to be created.
In early 2000, the cheap money stopped flowing and you saw a massive implosion in the pricing of all things technology because of all the excess production capacity created during the Tech Boom.
Scores of US Investors got ravaged, but the foundation was laid for the creation of the new Middle Class in the Emerging Markets
Real Estate
As the Tech Bubble was collapsing, the US Government needed to create a new bubble to stave off a Depression (yes I used the “D” word). The goal was to drive up the price of another asset class to full consumption via the “Wealth Effect”. The asset chosen was of course Real Estate.
In order to drive housing prices up, you need to increase demand. You increase demand by lowering the cost of money. You lower the cost of money in the following ways –
Cut Interest Rates
In late 2001 – 2002, Greenspan (appointed by a Republican and also used by a Democrat) gutted interest rates for historically low levels (1%). As rates fall, people refinance and their monthly payments go down.
Lower Lending Standards
You can also increase demand by lowering lending standards. The more people who can buy a house, the higher the prices go, so the US Government decided to allow people to lie on their loan applications and allowed the lenders to take those applications without checking the “facts” presented by the lenders.
Create Exotic New Ways to Finance
Banks started to create such things as 40 and 50-year mortgages. They created mortgages where you didn’t have to pay interest or principal until some future date. They created mortgages where your interest rate was artificially low for a set number of years.
People got greedy and used these new types of mortgages to buy homes they knew they couldn’t afford. Investors hoped that the price of their houses would go up and they could refinance in a few years.
Securitization
It used to be that when you needed a loan, you would go down to the bank and if they loaned you money, the bank would keep the loan on their books until you paid the loan off. They knew they were taking the risk, so they were smart about how they loaned it out.
Then some smart guy came along and told the banks that they could take the loans they made and lump them all together into a security and that security could be sold to private investors anywhere in the world. The idea would be that you would have “Ratings Agencies” tell you how much risk was in a security, that risk rating would determine the yield the security paid and also determine the interest paid by the initial borrow of the funds.
The Rating Agencies
If these guys do their job, then the system works. Because if you have bad credit, then the interest rate you would get on your loan would be so high, that you couldn’t afford to take the loan. If you have bad credit and don’t take the loan, then the bank doesn’t take on any risk.
But what really happened? The “Rating Agencies” failed to rate based on credit quality and instead got into a practice where they gave virtually ever security the same highest rating of “AAA”. This allowed banks to keep interest rates artificially low and allowed borrowers with bad credit to buy houses they couldn’t afford. There is absolutely no chance that this could occur without the explicit consent of the regulators and the US Government!
Oh, and did I mention that the banks who needed the highest credit rating on the securities they created were the same banks who paid the Rating Agencies to rate their securities? The Rating Agencies are now admitting before Congress that they would have rated dog sh*t AAA if a bank paid them enough money.
This is the Cliff Note version. I could go into a lot more detail, but I’ll spare you the outrage.
Implied Government Guarantee
Here is where all this stuff costs the taxpayers.
Again, foreign governments were the primary buyers of the securitized mortgages. They bought a lot of these issues from Freddie Mac and Fannie Mae. Freddie and Fannie are/were agencies of the US Government, which meant that the securities they backed had the “implied” backing of the US Government. Foreigners understood “implied” to mean “explicit”, just like the securities of Ginnie Mae and TVA have.
You remember the testimony before Congress in July where Paulson wanted the “Bazooka” to help him prevent Freddie and Fannie from failing? Did you know that at the time he was begging Congress for money, he was spending his evenings assuring Asian Central Banks that the securities banked by Freddie and Fannie had the “explicit” backing of the US Government?
Freddie and Fannie back about $4.5 trillion of mortgage debt. The US Taxpayer is now responsible for ALL OF IT!!!!!!!!! We are bailing out the Central Banks of Asia who knew damn well what they were buying. Moreover, the directly benefited not only from buying this crap, but the very creation of this crap, because it fueled the consumption in the US for the products manufactured in places like Japan and China and India…
Leverage
It just gets better!
Enron, Sarbanes-Oxley and You
You remember how the fall guy for the last bubble was carted off to jail and Congress had their hearings and the Sarbanes-Oxley Act was passed with great fanfare?
Do you remember what Enron did and Arthur Andersen signed off on? They did something called “off balance sheet accounting”. They basically took all of their losses and hid them in off-shore limited partnerships. When the news got out about what they were doing, Enron imploded and Arthur Andersen went under.
Why do I bring this up? Have you ever heard of a SIV? A “Structured Investment Vehicle”. Do you remember Paulson calling for a “Super SIV” earlier this year? A SIV is just an Enronesque off-balance sheet accounting trick used by banks. The Fed allowed banks to take the accounting trickery of Enron to a whole new level. They did so, so that banks could write a lot of bad mortgages and drive housing prices to ridiculously high levels.
Take Citigroup as an example. They have “assets” of $1.327 trillion. Did you know that they have off-balance sheet assets of another $1.2 trillion? Right now, Citigroup has a net worth of $67 billion. They are levered 37.7 to 1! That means the prices of the bonds that they hold only need to fall another 2.65% and Citi is out of business!!
The US Government allowed all this to happen and the taxpayer is now stuck paying the bill.
I’m tired of writing about this stuff. It goes so deep and it is so pervasive that I could write a book about it.
The bottom line is that this game has been going on for decades and the endgame is massive inflation to get rid of the real value of the debt.
Sunday, October 26, 2008
Thursday, October 23, 2008
Daily Volatility Bands
I have learned to use volatility bands derived at 5% intervals away from the 150-day moving average. Take a look at how the Dow has been trading the last 12 days (Black Box) and you can see why. Look at how the trading has been bound between the -20% Band (Red Line) and the -30% band (Green Line), with the -25% Band (Blue Line) as the pivot.
I don’t invent any of this stuff. I just study a lot and learn what big money uses in determining how and when they deploy money or sell holdings.
 Here is the NASDAQ 100 Index. See how it has tagged the -35% Band three times in the past 9 trading days (Black Arrows). This pattern is referred to as the “Charlie’s Angels” or a “Triple Bottom” (geek humor at it’s finest!). There is no such thing as a “Quadruple Bottom”, so the 1,175 level had better hold, or the next leg down will have begun.
The blue arrows are supposed to show today’s low of 1,177.17 versus the -35% Band at 1,178.51, but I cropped the picture poorly.

The S&P 500 Index ($SPX) and the Retail Sector (RTH) have similar charts.
All I can tell you is that these recent lows had better hold! We’ll see. If the lows fail, then there will be ample opportunity to make big piles of money in a short period of time. If the lows hold, then there may be a chance to make some decent coin of a reversion back to the 50-day average (currently 10,589 for the Dow Jones and 1,154 for the S&P 500).
A break above the trend line for RTH may set up a decent rally.


I’m going to do a lot of homework this weekend and see where good entry points are and if big money shows up to buy this market in the next few days, I will have stop buy orders in place to participate with them.
If big money starts to sell the markets hard again and takes out the recent lows, I will have stop buy orders in on the short ETFs and participate with them in the ensuing bloodbath.
I don’t care which way the markets go. I just want to be invested in the direction of the primary trend. I have ample resources to be invested Long or Short in very efficient vehicles. So I don’t care if the markets are rallying or crashing, because I can make money either way. This skill has allowed me to miss most of the pain of the last 14 months.
At some point, the markets will bottom and a new Bull Market will commence. I’m not smart enough to guess at what price the markets will bottom. I assume that the Dow and the S&P will undercut the lows of the 2000-2003 Bear Market, just to scare the heck out of people. But I will let the markets tell me when it is again time to get fully invested.
Remember, bottoming will be a process of 6 to 12 months. Leadership will show up and I have the skill to identify it when it does. Right now, there are 2 potential leading stocks in the Universe of 6,000 that trade decent volume. It will take months for new leadership to start showing up. I’ll keep you posted.
Thursday Trading
I sold my short positions in the first few minutes today and then looked to go long at some point later in the day.

200% Short Financials (SKF) bought 10/22 at $142 and sold on a stop limit of $153.5
200% Short Materials (SMN) bought 10/22 $85.5 and sold at market for about $92.5
I bought the following today -
Russia (RSX) stop buy at $14.15
200% Long Financials (UYG) stop buy at $8.25
200% Long Dow Jones Industrial Average (DDM) stop buy at $31.50
DDM was sold today on a stop loss at $32.75
I bought too early today. I had a stop in on DDM at $29.75 and raised it 3 times in the last hour today before stopping out for a decent profit.
I have been keying all of my trading activity off of the action of the Dow Jones Average. I have learned to do this, because it tends to lead all moves and temds be the most efficient in pricing these moves. Moreover, I believe that when the Fed ("The President's Working Group on the Markets" or "Plunge Protection Team") decides to accelerate the futures programs, they tend to focus their buying on the Dow Jones.
So if the Fed uses the Dow Jones to drive market action, then who am I to do otherwise with planning how to deploy my money...
Chart School 101
When entering a position, I use standard deviations away from the 260 period moving average on the 30 minute chart. I plot the 0.5, 1.0, 1.5, 2.0, 2.5 and 3.0 Bands above and below the 260 period EMA. These are referred to as Bollinger Bands for the guy who first created them.
Price is generally at extremes when it nears the +/- 3.0 Band. That is when you are looking for reversal patterns for a change in trend.
The last 2 days of trading have been stuck between the -1.0 Band (Pink Line) and the -1.5 Band (Purple Line). The Fibonnacci Lines and the uptrend line from the 10/10 low has also been in play.

Do you still think stocks are a "Random Walk"?
I will either be looking to sell a rally of the Dow into the 8,750 - 8,800 range, or I will get stopped out of holdings on selling tomorrow morning.
I would love to see the Dow hang around the 8,600 - 8,700 range for a few hours tomorrow and then break out or fail on big volume.
I am assuming a positive bias tomorrow. I just don't think the Fed wants the markets to fall hard on a Friday in October and set up the potential for a panic Crash on Monday. We'll see.
Wednesday, October 22, 2008
Understanding Charts 101
The current market is acting as if it were a lesson in a book on how to trade stocks. I am not sure why this is, but I think it is because the only guys left in the markets right now are people who need to sell and traders who are trying to make a few bucks each day.
Fibonacci Levels
If you read books on how to trade using stock charts, you are taught that markets tend to retrace specific percentages of a move before they initiate a new move. These levels are called Fibonacci Levels and are 38.2%, 50%, 62.8% and 76.4% of the low to high or high to low of the last move.
http://www.investopedia.com/terms/f/fibonacciretracement.asp
Trend Lines
Trend lines are essentially where you play connect the dots between the tops of a trend or the bottoms of a trend. The line formed by the tops becomes resistance and the line formed by the bottom becomes support.
http://stockcharts.com/school/doku.php?id=chart_school:chart_analysis:trend_lines
Consolidation Patterns
Periods were the markets trade in a tight range are called consolidations. These times of low volatility trading normally appear as triangles, flags, rectangles or wedges. Consolidations are normally followed by violent moves. They normally appear as a pause within a strong trend. So a violent move in one direction is followed by a consolidation pattern and then another violent move occurs in the same direction of the move which preceded the consolidation.
http://stockcharts.com/school/doku.php?id=chart_school:chart_analysis:chart_patterns
So why am I boring you with this stuff?
Again, because the markets are trading as if the charts are lessons in a book. I want to show this to you so all you can get an understanding of how institutional traders make a living.
Moreover, because I have an understanding of this stuff, I am able to manage risk by knowing when I have a high probability of making money and when I should be getting out of the way. Also, I don’t overreact when the market makes big moves one way or the other, because I know where the high probability reversal levels are.
Take a look at the Dow Jones since the 10/10/2008 low –
See how the tops were getting lower and the bottoms were getting higher (green lines)? That was telling me to be ready for a big move in one direction or the other.
The Dow spent the majority of 10/21 between 9004 (50%) and 9270 (61.8%).

Now take a look at how the market traded today! You can’t make this stuff up.
On this chart I have included the retracement levels from the 10/10 low to the 10/13 high (Blue Lines).
When the Dow Jones finally broke below 9,004, it then sold off 200 points in 15 minutes (Red Arrow)!
When the Dow took out 8,608, it sold off 275 points in about 20 minutes (Blue Arrow).
I figured that the 76.4% level of 8,328 (Blue Line and Purple Arrow) would come into play today on any break of 8608, and was ready to start to lock in profitable short positions at that level. The problem was that a hell of a lot of other traders had the same idea and the Dow rallied about 280 points in 12 minutes!
Guess where the rally stopped? That’s right, the rally stopped right at the broken uptrend line (Green Arrow), or 8,552.

The only question is how does the market open up tomorrow?
My guess is that the Dow will open tomorrow at or about 8,610. That would set an interesting wrestling match between 8,610 and 8,552. Maybe we get some new bailout package from the Fed over night and the market gaps up hard above 8,833. Nothing these days surprises me.
A Detailed Review of Today's Trading
I want to show you some trades I did today to give you an idea of how this market could be traded. I came into today short the Dow (via DXD) and short the Oil Sector (via DUG). I got lucky and walked into a sharply lower open, with DUG up about 10% and DXD up 5%. I sold both holdings in the first few minutes of trading.
My goal today was to wait for the market to trade in these consolidation patterns and then buy or short the market based on how the market moved.
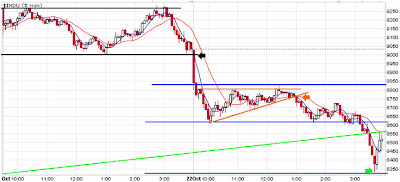
Here is a chart of the Dow Jones over the past two days -
The consolidation of 10-21 was taken out of play, because when the Dow started trading on 10-22, it opened -200 points lower than it closed on 10-21. I closed out my positions in DXD and DUG quickly, because I thought the markets would have a bigger bounce from 8,833 (top Blue Line) than actually materialized.
The Dow hit the 61.8% retracement line at 8,620 and then spent most of 10-22 trading between the two blue lines. The triangle pattern formed and I chose to short the market on a break of the triangle (Orange Arrow). I figured that a test of the green line would materialize on 10-22 or 10-23, and was willing to wait for it to do so. However, I got a bonus in that the selling carried all the way down to 8,335 (Green Arrow)!
I was able to cover some of my shorts, but the market rallied up 250 points in 12 minutes and I was not able to get all my shorts covered in those few minutes when I really liked the prices I was getting.
I shorted the market via the following at about 1:10 pm EDT -
-200% Inverse Emerging Markets – EEV at $150.5
-200% Inverse Financials – SKF at $142
-200% Inverse Materials – SMN at $85.5
-200% Inverse S&P 500 – SDS at $87.50
Here is a daily chart of the Dow. Two things stick out –
1. At some point price will catch up to the black line. It always does. The question is does price rally sharply to touch the line, does the line implode lower to catch price or do they meet somewhere in the middle?
2. The Dow is in a 2,200-point triangle (Green Lines). This is a classic consolidation after a 3,000 point selloff. A break of this pattern would target 6,300 on the downside. Holy cow! I do not make price target predictions. I am just trying to give you an idea of the potential magnitude of the next move.
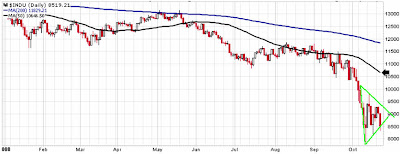
I am not certain which way the Dow breaks (up or down), but I am fairly confident that it will move up or down with tremendous violence in the not too distant future.
I want in on that move!!
My goal today was to wait for the market to trade in these consolidation patterns and then buy or short the market based on how the market moved.
Here is a chart of the Dow Jones over the past two days -
The consolidation of 10-21 was taken out of play, because when the Dow started trading on 10-22, it opened -200 points lower than it closed on 10-21. I closed out my positions in DXD and DUG quickly, because I thought the markets would have a bigger bounce from 8,833 (top Blue Line) than actually materialized.
The Dow hit the 61.8% retracement line at 8,620 and then spent most of 10-22 trading between the two blue lines. The triangle pattern formed and I chose to short the market on a break of the triangle (Orange Arrow). I figured that a test of the green line would materialize on 10-22 or 10-23, and was willing to wait for it to do so. However, I got a bonus in that the selling carried all the way down to 8,335 (Green Arrow)!
I was able to cover some of my shorts, but the market rallied up 250 points in 12 minutes and I was not able to get all my shorts covered in those few minutes when I really liked the prices I was getting.

I shorted the market via the following at about 1:10 pm EDT -
-200% Inverse Emerging Markets – EEV at $150.5
-200% Inverse Financials – SKF at $142
-200% Inverse Materials – SMN at $85.5
-200% Inverse S&P 500 – SDS at $87.50
Here is a daily chart of the Dow. Two things stick out –
1. At some point price will catch up to the black line. It always does. The question is does price rally sharply to touch the line, does the line implode lower to catch price or do they meet somewhere in the middle?
2. The Dow is in a 2,200-point triangle (Green Lines). This is a classic consolidation after a 3,000 point selloff. A break of this pattern would target 6,300 on the downside. Holy cow! I do not make price target predictions. I am just trying to give you an idea of the potential magnitude of the next move.

I am not certain which way the Dow breaks (up or down), but I am fairly confident that it will move up or down with tremendous violence in the not too distant future.
I want in on that move!!
The Market is ALWAYS Right!
If you ever hear a Money Manager say the following, ask him for your money back immediately –
“The market is wrong”
The market is NEVER wrong. EVER!
After a great deal of studying, I determined that there was a high probability that money would again flow into the inflation/leverage trades in the very near future. I figured that the driver would be a successful cash settlement of the Lehman CDS holdings at banks.
Well, Lehman CDS settled without a hitch and what happened? The Dow sold off 400 points in the first 30 minutes of trading this morning. The market is always right, so I took defensive action.
Last week I started to take small positions in front of the Lehman CDS settlement. Here is what I bought and what I paid (average) –
5% Natural Gas (UNG) $30.50 limit
5% Euro (FXE) $133.50 limit
5% Russia (RSX) $16.10 limit
5% Gold (GGN) stop buy at $11.50 never triggered
5% Swiss Franc (FXF) stop buy at $88.5, then $86.8 never triggered
Here are my stop loss limits -
UNG stop loss $30 triggered today
FXE stop loss $128.25 not triggered yet
RSX stop loss $14.55 not triggered yet
I cancelled all buy orders on GGN and FXF.
So the likely maximum I will lose on these trades is a whopping 0.755% for clients.
I think it was worth the risk to try and make a BIG gain.
The bottom line is this – IT IS OKAY TO BE WRONG, BUT IT IS NOT OKAY TO STAY WRONG!!!!
With the Bearish action today, I went short a mix of the following for clients and myself –
Financials (SKF)
Emerging Markets (EEV)
Materials (SMN)
I may end up covering my short positions as early as tomorrow morning.
Tuesday, October 21, 2008
Earnings Releases for the Banks with Massive Derivative and no Bailout
https://blogger.googleusercontent.com/img/b/R29vZ2xl/AVvXsEhpaUQzFNbSvuO1Vy5KdOMXcjZNknp-4pjYCIM1Jy7U_yjUMwkvqeoFVGti3JQpKG4nUZ7aZZm_0UaTp_oB4vi2iCecHz6NjOJLQfhyVq84nJ3o3h4wSdLdORF3Foq_nVpiiJmvyzG8O-cI/s1600-h/Derivatives.jpg
In the past few days, earnings have been announced by 7 of the 9 remaining banks which have massive derivative exposure, but haven't yet been bailed out by a Central Bank, and the earnings have been horrible.
National City (NCC) #14
The lasted earnings (8K released 10/21/2008) can be found here -
http://phx.corporate-ir.net/phoenix.zhtml?c=64242&p=irol-sec
The release is 129 pages! Oh my. In an effort to protect clients' assets, I have learned how to decypher these things , as in the past 18 months I have been forced to read everything from Level III asset filings to Money Market Fund Prospectuses.
The management of National City can say what they want and try and manipulate the "market to market pricing" of vast swaths of their assets to goose their earnings higher, but here is what I see for NCC -
Market Capitalization $6.47 billion
Non-performing Assets $3.537 billion
Home Equity Lines and Loans $15.8 billion (page 75)
Total Loans $111.2 billion (these are "assets" on the books of banks)
So an equivalent of 3.2% of their loans have already been written off as total losses. If real estate prices fall a little further (highly likely), or credit cards delinquencies rise (highly likely) or they "mispriced" there assets be even a little bit (remember when Merrill Lynch sold that $30 billion bond portfolio for an effective price of 5.8 cents on the dollar a few months ago) (highly likely), then NCC will take a large enough loss to wipe out ALL of their equity and be insolvent!
Take a look at what people who had their money managed by NCC did the past quarter -
Assets under management -
Equities down -58% in the most recent quarter (page 68)
Bonds down -26% in the same quarter (page 68)
They pulled their money out. They clearly were nervous enough to move their money.
My big concern is that NCC has over $110 billion in derivative exposure (394% of what Lehman had). If National City were to go out of business (which seems like a real possibility after reading the 8K filing), then the markets would melt down yet again.
The Fed/US Treasury gets this and in my opinion will not allow National City to fail. I think NCC will either get nationalized or bought by a larger bank in the not too distant future. I have no clue whether they get bought out for a premium or a discount to the current price and personally choose to avoid all exposure to anything bank related.
US Bancorp (USB) #15
USB may another train wreck waiting to happen, with a $87.448 billion derivative portfolio.
This quarter, the delinquency rates on their loan portfolio increased markedly (pages 43 of 46).
http://media.corporate-ir.net/media_files/irol/11/117565/USB_3Q_2008_Earnings_Release_and_Supplemental_Analyst_Schedules.pdf
The one think US Bank has going for it is that their new worth is enormous ($54 billion) when compared to the other names on this list.
So USB may end up being a buyer of other banks, and not get taken over or sold at a deep discount. Again, I do not own it and have no intention of doing so. Buy it or short it at your own risk!!
Fifth Third Bank (FITB) #20
Same story as NCC, but the release is only 14 pages -
http://media.corporate-ir.net/media_files/irol/72/72735/FifthThird3Q08EarningsRelease1021.pdf
PNC Financial (PNC) #10 and BB&T (BBT) #17
Seems to be more in the camp of US Bank. I think they will be buyers and not sellers. Just a guess, but we'll see. Same disclaimer as above...
Remember, they can only by buyers if the Fed gives them big piles of money. So expect these guys to get bailed out. In Fed Speak, it will be a "injection of capital" in the form of the Fed buying preferred stock "at no risk to the taxpayer".
Keycorp (KEY) #13 and Regions Financial (RF) #16
See NCC
The 2 stragglers are Suntrust (STI) #9 and Northern Trust (NTFS) #11
In my opinion, these are coin flips are to whether they are acquirers or acquirees.
Time will tell, but we should know in the next few months who the survivors with massive derivative exposure are. Then the giant game of "Go Fish" will begin!
Subscribe to:
Posts (Atom)